

How Phillips 66's Integrated Model Enhances Profitability & Resilience


Phillips 66 PSX is a leading refining player that stands to gain from the current weakness in crude prices. Per the data from the U.S. Energy Information Administration, the West Texas Intermediate spot crude price average is expected to fall from $65.40 per barrel in 2025 to $52.21 in 2026. The softness in crude prices benefits refining players like Phillips 66, as it reduces input costs. Lower crude prices should enhance PSX’s refining margins, aiding its profitability.
Additionally, PSX benefits from its diversification across multiple sectors, including midstream, chemicals and renewables, as it provides earnings and cash flow stability. Therefore, during a weaker refining environment, PSX can rely on its diversified business model to sustain profitability. Further, PSX’s diversified business model supports consistent cash flow generation, enabling the company to fund shareholder returns, reduce debt and pursue attractive growth opportunities.
Phillips 66 is also pursuing a strategy of divesting non-core assets and allocating the proceeds toward its strategic priorities, including increasing shareholder returns and capitalizing on growth opportunities. These initiatives allow the company to free capital from non-core assets and allocate it toward high-return opportunities that drive long-term growth.
VLO & PARR Are Two Other Leading Refiners
Valero Energy Corporation VLO and Par Pacific Holdings PARR are two other refining players with a diversified refinery footprint.
Valero Energy boasts an extensive refinery network, with 15 refineries and a combined throughput capacity of 3.2 million barrels per day. VLO’s diversified refinery base enables it to tap into different markets and cater to a diverse range of customer needs.
Par Pacific Holdings is a Houston-based refining player with a combined refining capacity of 219,000 barrels per day, and operations spread across Hawaii and the Pacific Northwest. The company also operates 119 retail locations, along with a logistics business segment.
PSX’s Price Performance, Valuation & Estimates
Shares of Phillips 66 have gained 14.3% over the past six months compared with the 13.1% rally of the composite stocks belonging to the industry.
 Image Source: Zacks Investment Research
From a valuation standpoint, PSX trades at a trailing 12-month enterprise-value-to-EBITDA (EV/EBITDA) of 14.57X. This is above the broader industry average of 4.72X.
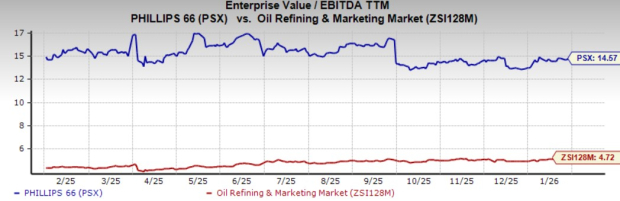
Image Source: Zacks Investment Research
The Zacks Consensus Estimate for PSX’s 2025 earnings has been revised downward over the past seven days.
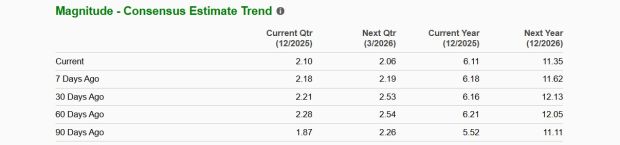
Image Source: Zacks Investment Research
PSX, VLO and PARR currently carry a Zacks Rank #3 (Hold). You can see the complete list of today’s Zacks #1 Rank (Strong Buy) stocks here.
Beyond Nvidia: AI's Second Wave Is Here
The AI revolution has already minted millionaires. But the stocks everyone knows about aren't likely to keep delivering the biggest profits. Little-known AI firms tackling the world's biggest problems may be more lucrative in the coming months and years.
SeeWant the latest recommendations from Zacks Investment Research? Today, you can download 7 Best Stocks for the Next 30 Days. Click to get this free report
Valero Energy Corporation (VLO): Free Stock Analysis Report
Phillips 66 (PSX): Free Stock Analysis Report
Par Pacific Holdings, Inc. (PARR): Free Stock Analysis Report
This article originally published on Zacks Investment Research (zacks.com).
Source Zacks-com