

Is Digital Adoption Strengthening Dutch Bros' Drive-Thru Model?


Dutch Bros Inc. BROS exited 2025 with higher digital engagement embedded in its predominantly drive-thru operating model. During the fourth quarter, Order Ahead represented approximately 14% of system transactions, reflecting increased customer use of mobile ordering alongside traditional drive-thru demand. The walk-up window accounted for roughly 18% of the channel mix in the fourth quarter of 2025, indicating broader utilization of non–drive-thru order points.
Loyalty participation also expanded during the year. Dutch Rewards surpassed 15 million members by the end of 2025, with the program accounting for approximately 72% of system transactions for the full year. The company indicated that both Order Ahead and loyalty penetration increased as a percentage of sales, including in newer markets, where adoption rates were described as running above system averages.
These developments coincided with continued transaction-led sales performance. In the fourth quarter, system same-shop sales increased 7.7% year over year, supported by 5.4% transaction growth. For full-year 2025, system same-shop sales grew 5.6% year over year, with the company citing transaction growth as a primary contributor.
From an operational perspective, the company highlighted refinements in labor deployment and training alongside the expansion of digital channels. During 2025, Dutch Bros implemented a new training model and aligned labor more closely with customer demand patterns. Order Ahead was described as activating the walk-up window and helping distribute order volume across the shop.
Looking ahead, Dutch Bros is guided to 3%-5% system same-shop sales growth in 2026, reflecting a moderation from 2025 levels. The outlook incorporates the continued use of Order Ahead, sustained loyalty participation, the phased rollout of the food program and planned unit expansion, with at least 181 new system shops expected to open during the year.
How It Stacks Up to Competitors
Dutch Bros’ digital approach places it alongside, but structurally distinct from, the broader digital and loyalty strategies being executed by Starbucks Corporation SBUX and McDonald's Corporation MCD. While all three brands are scaling digital engagement, differences emerge in platform scale, operating context and primary areas of emphasis.
Starbucks continues to prioritize digital depth and loyalty engagement within a café-led model. In first-quarter fiscal 2026, Starbucks Rewards reached 35.5 million 90-day active members, the highest level reported by the company. Digital initiatives span mobile ordering, order sequencing technology and AI-enabled tools focused on order accuracy and service times. Starbucks’ digital ecosystem is embedded across ordering, payments and customer engagement, with technology investments largely oriented toward improving throughput and in-store execution as part of its broader operational reset.
McDonald’s, by contrast, operates at a significantly greater digital scale. In 2025, the company reported nearly 210 million 90-day active loyalty users across 70 markets, reflecting the global reach of its app-based platform. Digital engagement has been driven in part by large-scale promotions such as MONOPOLY. The McDonald’s app also supports features like Ready on Arrival, which links mobile ordering with order preparation timing, reinforcing a systemwide focus on speed and consistency across a highly standardized global footprint.
Within this landscape, Dutch Bros’ digital model is differentiated by its level of penetration within a drive-thru–centric format. Unlike Starbucks’ cafe-oriented ecosystem or McDonald’s globally scaled platform, Dutch Bros’ digital engagement is concentrated at the shop level, where ordering channels, loyalty participation and operations are tightly integrated. This structure reflects a more compact but highly embedded digital footprint relative to larger, multi-format peers.
BROS’ Price Performance, Valuation & Estimates
Shares of Dutch Bros have plunged 37.2% in the past year compared with the industry’s fall of 7.8%.
BROS’ One-Year Price Performance
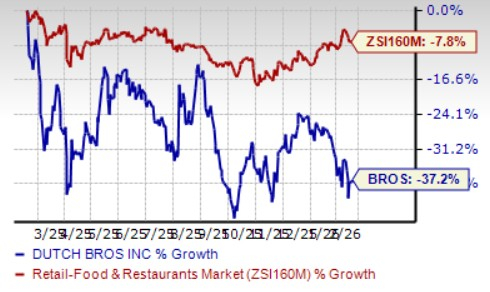
Image Source: Zacks Investment Research
From a valuation standpoint, BROS trades at a forward price-to-sales (P/S) multiple of 4.22, above the industry’s average of 3.68.
BROS’ P/S Ratio (Forward 12-Month) vs. Industry

Image Source: Zacks Investment Research
The Zacks Consensus Estimate for BROS’ 2026 earnings per share (EPS) implies a year-over-year uptick of 13.2%. The EPS estimates for fiscal 2026 have declined in the past 30 days.
EPS Trend of BROS Stock
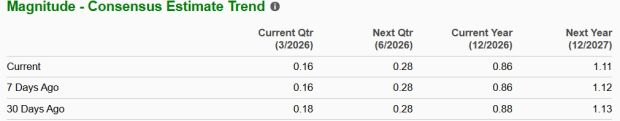
Image Source: Zacks Investment Research
BROS stock currently has a Zacks Rank #4 (Sell).
You can see the complete list of today’s Zacks #1 Rank (Strong Buy) stocks here.
5 Stocks Set to Double
Each was handpicked by a Zacks expert as the #1 favorite stock to gain +100% or more in the coming year. While not all picks can be winners, previous recommendations have soared +112%, +171%, +209% and +232%.
Most of the stocks in this report are flying under Wall Street radar, which provides a great opportunity to get in on the ground floor.
Today, See These 5 Potential Home Runs >>Want the latest recommendations from Zacks Investment Research? Today, you can download 7 Best Stocks for the Next 30 Days. Click to get this free report
Starbucks Corporation (SBUX): Free Stock Analysis Report
McDonald's Corporation (MCD): Free Stock Analysis Report
Dutch Bros Inc. (BROS): Free Stock Analysis Report
This article originally published on Zacks Investment Research (zacks.com).
Source Zacks-com