

The Volatility Illusion: S&P Flat While Stocks Gyrate


Market Indices Mask Stock Volatility
I often like to tell Technology Innovator subscribers that roughly 75% of a stock’s move is correlated with the general market’s action. In other words, like a rising tide, in a rising market most ‘boats’ (in this case stocks) rise. Conversely, although there are exceptions, in a falling market, most stocks and assets fall. Overall, investors need to monitor the overall market trend and ensure their investments are in lockstep with it.
That said, each market environment is unique, and investors must be cautious when abnormal or tricky market environments emerge. The current market environment is one such example. Over the past month, the average stock was very volatile, moving 10.8%. A 10.8% average move is above average in a normal month. However, what makes the last month especially unique is that the S&P 500 Index is flat as a pancake. According to Nomura, the 10.5% spread between the S&P 500 and the average stock ranks in the 99th percentile over the past 30 years. In fact, over the past 30 years, the spread between the two has only been higher twice: in 2000 during the dot-com bust and in 2008 during the global financial crisis.
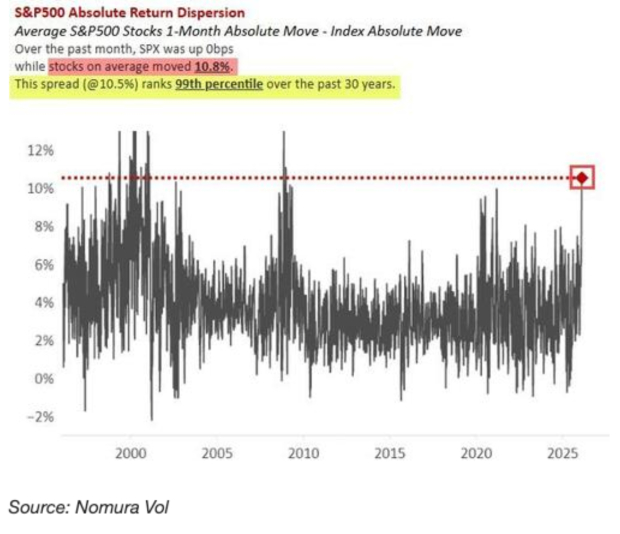
Image Source: Nomura
Nomura’s Managing Director, Charlie McElligot, shared his thoughts on the date:
"Over the past month, SPX was up 0 bps while stocks on average moved almost 11%. McElligott points out that we’re seeing stunningly large, and highly divergent, moves across single-name equities and their volatility. But those moves are effectively offsetting each other at the index level, muting spot performance and suppressing index volatility via a classic “correlation crunch.”
Does such a spread mean that more volatility is coming and a 2000 or 2008-like market blow-up is coming? The answer is uncertain. That said, investors must understand that the major indices like the S&P 500 Index are masking extreme volatility ‘beneath the surface.’ According to Nomura’s data, forward returns are spotty:

Image Source: Zacks Investment Research
However, with only a handful of instances over the past few decades, it’s tough to draw concrete conclusions. While the reasoning behind market moves are often unrealized until after they occur, some market forces driving volatility include:
1. AI CAPEX Spending Concerns: Hyperscalers such as Alphabet (GOOGL) and Meta Platforms (META) are estimated to spend more than $500 billion in CAPEX in 2026 to drive their AI offerings. With such unprecedented spending, some investors worry that the ROI will be insufficient.
2. AI Disruption is Impacting Software and Other Industries: AI disruption concerns have led to swift corrections in companies like Charles Schwab (SCHW), Thomson Reuters (TR), and Monday.com (MNDY).
3. Geopolitical Concerns: Tensions between Iran and the United States are reaching a tipping point.
4. Upcoming Midterm Elections: Markets are often volatile in the months leading up to midterm elections.
5. Tariff Ruling Uncertainty: A Supreme Court decision on the Trump Administration’s tariff policy is imminent.
What Should Investors Do?
In fact, in volatile markets, the best thing an investor can do is slow down and reduce position sizing. Large swings can lead to knee-jerk decisions and emotional trading among investors. Also, traders have the option of sitting out the market until the trend direction becomes clearer and volatility subsides.
Bottom Line
While the major indices might suggest a quiet market environment, the reality is that individual s are stocks are exhibiting turbulent action. We are witnessing a historic divergence, with investors whipped around by hidden volatility.
Zacks' Research Chief Picks Stock Most Likely to "At Least Double"
Our experts have revealed their Top 5 recommendations with money-doubling potential – and Director of Research Sheraz Mian believes one is superior to the others. Of course, all our picks aren’t winners but this one could far surpass earlier recommendations like Hims & Hers Health, which shot up +209%.
See Our Top Stock to Double (Plus 4 Runners Up) >>Want the latest recommendations from Zacks Investment Research? Today, you can download 7 Best Stocks for the Next 30 Days. Click to get this free report
The Charles Schwab Corporation (SCHW): Free Stock Analysis Report
Alphabet Inc. (GOOGL): Free Stock Analysis Report
monday.com Ltd. (MNDY): Free Stock Analysis Report
Meta Platforms, Inc. (META): Free Stock Analysis Report
This article originally published on Zacks Investment Research (zacks.com).
Source Zacks-com