

"It's very hard to go against the crowd. Even if you've done it most of your life, it still jolts you." --David Dreman


Winter Follows Autumn

WINTER FOLLOWS AUTUMN (June 30, 2024): Many investors have embraced the mythical "soft landing" scenario. Every multi-year bull market in U.S. history, with steady growth and low inflation, eventually becomes overheated with above-average inflation, just as every moderate spring season is followed eventually by a hot humid summer. This overheating is followed by a choppy, dramatic slowdown during which inflation unevenly declines while GDP growth decelerates and eventually goes negative. It is similar to summer being followed by autumn. Then, just as autumn must lead into winter, negative GDP growth--also known as a recession--is accompanied by an equity bear market. As often as this scenario has repeated itself in the United States since the 1700s, many people today are convinced that we're going to magically transition from colorful falling leaves directly into blossoming flowers and warming temperatures.
The weather doesn't work that way and neither does the economy or the stock market. The Russell 2000 and many other consistently reliable leading indicators have been in bear markets since 2021, with numerous lower highs along the way. After the leaves have reached peak color in November, the next month isn't going to be April or May. Instead we get December, and usually an even colder January, and then a volatile February. Winter is approaching. You can dream of spring eventually returning, but to expect it to happen immediately after autumn is fantasy.
Top corporate insiders have been selling at an all-time record pace, not only in the popular AI shares but in numerous absurdly overpriced U.S. large-cap stocks.
We can spend hours or days debating whether or not Nvidia is overvalued, but let's instead look at a more clear and revealing instance of the current U.S. large-cap bubble. For four decades, Costco (COST) has been growing its profits at 10% or 11% per year, with its price-earnings ratio fluctuating from high single digits to low double digits. Recently Costco has sported a price-earnings ratio of 53.8. There are many possibilities about what the future might bring, but Costco growing its profits at a 50% annualized pace will never happen even if we are invaded from other galaxies and the invaders are eager to buy all of their supplies at Costco. If you didn't flunk kindergarten then you can calculate how much Costco's stock price has to drop to return to its long-term valuation.
Each time that analysts cheer allegedly "great" earnings from any company, the stock price usually immediately surges higher. Within a day or two the top executives usually make massive sales, taking advantage of the irrationally high valuations. Either 1) these insiders are correct by doing their heaviest selling in history by a wide margin, often selling years' worth of accumulated shares; or 2) the least-knowledgeable investors are correct by making all-time record inflows into the U.S. stock market. I know which side I'm betting on.
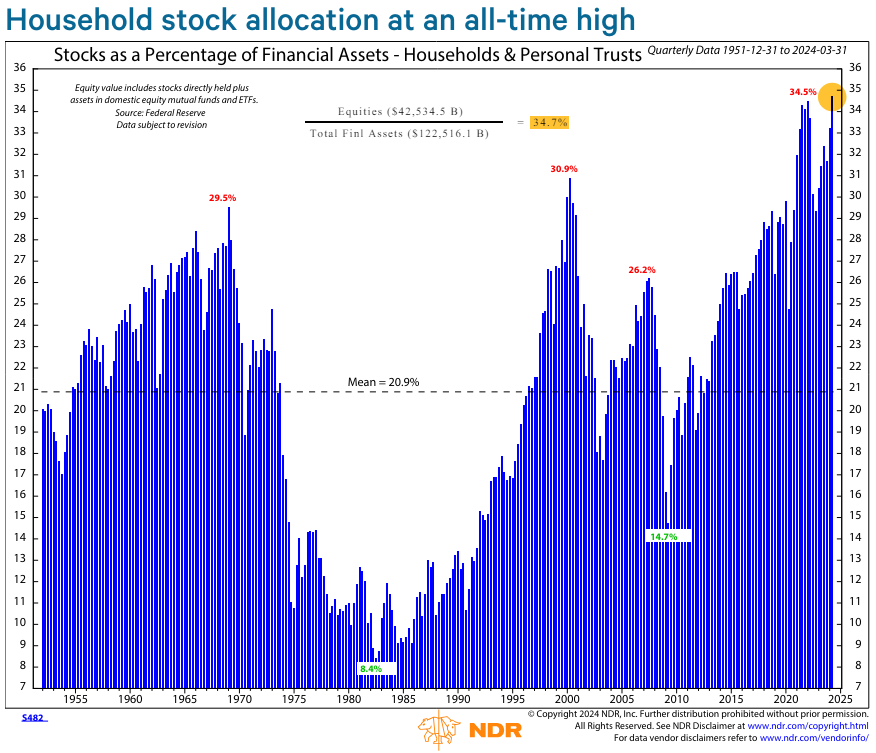
While top corporate insiders have done their heaviest selling in history during 2024, ordinary investors have done their most aggressive buying in history. Which group is right? History shows us the clear answer.
Ordinary households recently set a new all-time record allocation to the U.S. stock market, about four times their lows from the early 1980s and significantly higher than at the 2000 internet bubble top:
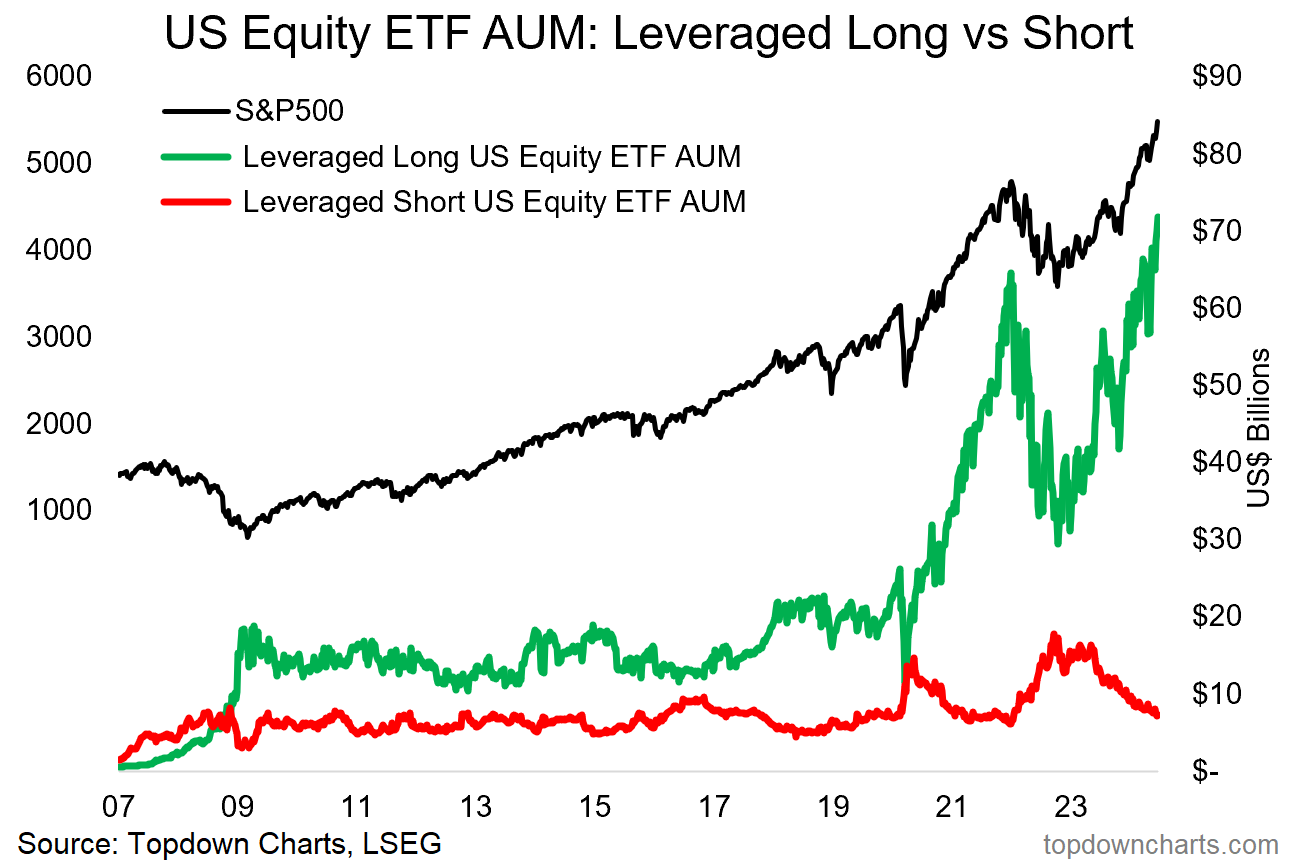
Overconfident investors have also set new records by piling into leveraged long U.S. equity funds, while bailing out of leveraged short funds in their certainty that a significant percentage loss for the U.S. stock market won't happen any time soon:
Other assets including residential real estate have become dangerously overpriced, although they are generally not as wildly overvalued as large-cap U.S. stocks.
Real estate worldwide had been reasonably priced for decades until 1997. Since then, we have experienced housing bubbles worldwide to varying degrees, with the U.S. reaching a bubble peak in 2005-2006 and an even higher bubble zenith in 2022-2024. Here is a chart of U.S. real residential housing prices from January 1976 through June 2024:
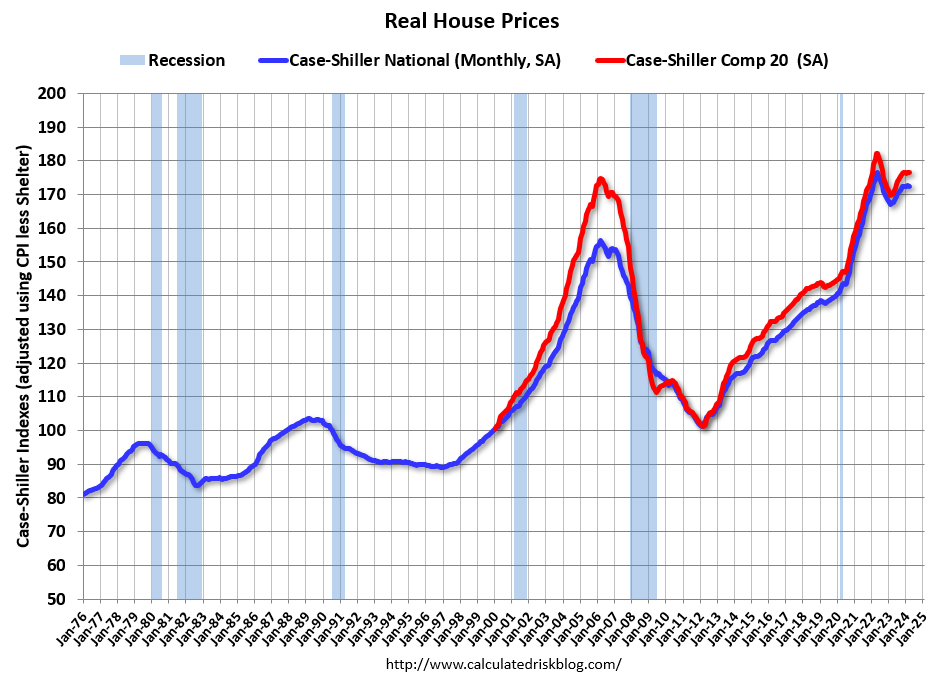
While U.S. houses are about twice as high relative to household incomes as compared with their long-term averages, Canadian real estate in early 2022 had reached triple fair value. Whenever any asset is fundamentally very under- or overvalued it must experience a volatile price adjustment in order to return to fair value.
The primary argument for owning any cryptocurrency is that a famous person also owns it and endorses it (and we would be shocked, shocked to hear that such a person is being paid for doing so).
With cryptocurrencies we don't even know what fair value is, because there is no proven history. Bitcoin is the oldest cryptocurrency which was invented in 2009, when the previous severe bear market was ending. Therefore, we have no clue as to how these will perform in another true bear market. It is like buying a rare tropical plant, putting it in your back yard in a place where it goes below freezing numerous times each winter, and assuming that it will thrive. It might be in wonderful shape by August or September, but it may not be in prime condition several months later. Why anyone would want to own such an unproven asset is beyond my limited ability of comprehension.
High-yield corporate bonds have mostly been approaching their lowest-ever spreads relative to U.S. Treasuries.
There are times when U.S. high-yield corporate bonds are at incredibly undervalued levels, such as they had been in years including 1932-1933 and 2008-2009, and there are periods like 2024 when their spreads to U.S. Treasuries have approached or set all-time record lows. Investors love to buy near all-time highs because they perceive elevated prices as proof of any asset's superiority, whereas they end up selling in disappointment near multi-year bottoms since all they hear about is how prices will keep on dropping.
A surprisingly diverse range of assets have quietly become absurdly undervalued, including some major emerging-market equity bourses.
While the price surges for stocks, real estate, cryptocurrencies, and high-yield corporate bonds have resulted in unsustainably overpriced levels being achieved, there are numerous assets which are trading well below fair value. Most emerging-market securities have been trading near their lowest relative valuations in years or decades, with stocks in countries including Brazil, China, Indonesia, and the Philippines being especially worthwhile bargains. Because the early stages of any severe bear market tend to be accompanied by a high degree of correlation, these bargains will probably become even better bargains during the upcoming year which makes it important to be patient before jumping in too soon.
Several less-heralded assets have been or will soon be completing multi-decade bottoms.
Other assets have become cheap enough to be worth purchasing immediately without waiting for lower prices. During the past several months we have had repeated downward spikes for assets as diverse as long-dated U.S. Treasuries (TLT), palladium (PALL), and the Japanese yen (FXY). U.S. Treasuries and their funds including TLT probably completed two-decade bottoms in October 2003 and added key higher lows in April 2024, while PALL may have bottomed in February 2024 at 78.50 and recently slid almost all the way back to higher lows just above 80. The most recent in this group to make new lows has been the Japanese yen, which during the past week touched its lowest level versus the U.S. dollar since 1986.
Funds of precious metals shares including GDX and GDXJ will eventually become compelling buying opportunities, but history and the traders' commitments tell us clearly that we must wait several months or longer before taking action.
QQQ dropped 83.6% from its peak on March 10, 2000 to its bottom on October 10, 2002. Meanwhile, HUI, an index of gold mining shares, completed a key bottom on November 15-16, 2000 and before the end of 2003 was worth more than seven times as much. Therefore, wait several months after QQQ has begun a major bear market and then get ready to aggressively purchase gold mining and silver mining shares. Be patient and don't act too soon.
One way we can be certain that it is too early to buy GDX or GDXJ is that the traders' commitments are especially bearish for gold, silver, and platinum. With gold, commercials (see cftc.gov) who own physical gold such as miners, fabricators, and jewelers are long 86,551 and short 358,039 contracts which is more than 4:1 short to long. Non-commercials (primarily hedge funds) are long 284,885 and short 38,656 which is more than 7:1 long to short. Regardless of how much gold China's central bank does or doesn't buy, these are unsustainable speculative longs which will be dramatically flushed out over the next several months. Gold bullion will drop below two thousand U.S. dollars per troy ounce and could eventually fall below 1800 before powerfully rebounding afterward.
The bottom line: it's not different this time. Don't fall victim to the soft-landing myth. As well-known stocks including Apple (AAPL) and Costco (COST) have been have been trading for roughly five times their long-term average price-earnings ratios, the only realistic possibility will be massive percentage losses for large-cap U.S. stocks during the next few years. Following bubble peaks, stocks don't just retreat from overvalued levels to fair value and stop dropping; they usually end up with undervaluations of 35% to 60% as we had previously experienced in years including 2008-2009 and 2002-2003. U.S. Treasury yields have been close to their highest levels in more than two decades and will serve as an irresistible magnet once U.S. stocks have fallen enough to make some investors nervous about continuing to be so heavily overinvested in the most popular big U.S. companies.
Disclosure of current holdings:
Below is my current asset allocation as of 4:00 p.m. on Friday, June 28, 2024. Each position is listed as its percentage of my total liquid net worth.
I computed the exact totals for each position and grouped these according to sector.
The order is as follows: 1) U.S. government bonds; 2) shorts; 3) bear funds; 4) gold/silver mining; 5) coins; 6) miscellaneous securities.
VMFXX/TIAA(Traditional)/bank CDs/FZDXX/FZFXX/SPRXX/SPAXX/BPRXX/Savings/Checking long: 37.24%;
17-Week/52-Week/26-Week/13-Week/2-Year/8-Week/3-Year/5,10-Year TIPS/4-Week/42-Day long/20-Year: 22.91%;
I Bonds long: 11.01%;
TLT long: 10.75%;
PMM long: 0.01%;
XLK short (all shorts are once again unhedged): 34.84%;
QQQ short: 23.78%;
SMH short: 1.61%;
AAPL short: 0.12%;
SARK long: 1.00%;
PSQ long: 0.04%;
PALL long: 1.10%;
Gold/silver/platinum coins: 7.12%;
FXY long: 0.58%.
Steven Jon Kaplan runs True Contrarian where this article appeared first.
Source truecontrarian-sjk
Apple Inc. Stock
Currently there is a rather positive sentiment for Apple Inc. with 136 Buy predictions and 14 Sell predictions.
With a target price of 210 € there is a slightly positive potential of 2.87% for Apple Inc. compared to the current price of 204.15 €.