

How does sharewise work?
Discuss
Discuss and share predictions for your favorite stocks in the forum. Let your opinion be heard
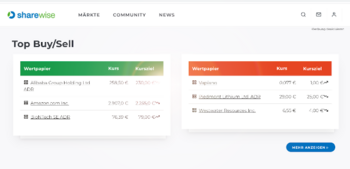
Show moreTop Buy/Sell (This Month)
| Security | Price | Target price |
|---|---|---|
| Micron Technology Inc. | €822.30 | €1,297.5 |
| Oracle Corp. | €124.04 | €257.37 |
| Delta Air Lines Inc. | €77.63 | €75.11 |
| Security | Price | Target price |
|---|---|---|
| Lennar Corp. A | €76.00 | €73.20 |
| Jetblue Airways Corp. | €5.02 | €3.44 |
| Southern Copper | €148.65 | €123.05 |
New Top predictions since last week
| Prediction | User | Perf. (%) |
|---|---|---|
| B Crinetics Pharmaceuticals Inc | UBS Group AG | 99.62% |
| B Battalion Oil Corp. | DerAlmanach100000 | 41.82% |
| B Agios Pharmaceuticals Inc. | Truist Financial Co. | 14.88% |
| Prediction | User | Perf. (%) |
|---|---|---|
| S Ast Spacemobile Inc. | mixitrader | -13.79% |
| S Sandisk Corp. | mixitrader | -12.35% |
| S Ionq Inc. | nvestor | -9.87% |
Many tell you which stocks to buy.
We measure how often they are right!


Portfolios of our members
A.D.S.....9

When it comes to stocks, what is important for you?
Find stocks based on your criteria with our sharewise stock finder. All results are based on thousands of votes by our community
Pros and Cons of these stocks (New Predictions)
Geci International S.a.
WKN: A3E2CS / Name: Geci International S.a. / Stock / ? /
Pros
Cons
BICO Group AB
WKN: A2PX00 / Name: BICO Group / Stock / Small Cap /
Pros
Cons
Try sharewise+ and get hundreds more matching stocks
Sign up for free!Tops & Flops S&P 500
| Security | Price | Change(%) (%) |
|---|---|---|
| Occidental Petroleum Corp. | €45.26 | 6.180% |
| Cognizant Technology Solutions Corp. | €38.49 | 5.930% |
| Devon Energy Corp. | €37.16 | 5.900% |
| APA Corporation | €29.79 | 5.780% |
| ConocoPhillips | €94.99 | 5.150% |
| Security | Price | Change(%) (%) |
|---|---|---|
| Teradyne Inc. | €299.85 | -10.200% |
| Intel Corp. | €96.73 | -9.560% |
| KLA-Tencor Corp. | €189.70 | -8.050% |
| Ipg Photonics | €84.54 | -7.930% |
| Western Digital Corp. | €466.20 | -7.880% |
Courses
sharewise Introduction

Get started on the stock market in these easy steps
Things you will learn:
- What is a stock
- What is a fund
- What is an ETF
- How to open a depot
- How to manage a depot that will regularly beat managed funds
- Why you mostly need patience to succeed on the stock market
Predictions
Trimble Navigation
07.07.26
07.07.27
07.07.26
Top News

Apple and Broadcom Forge a Decade-Long Silicon Fortress
Key Points
- Interested in Apple Inc.? Here are five stocks we like better.
- Apple and Broadcom extended their custom chip and wireless component partnership through 2031, sending Broadcom shares up
SK Hynix’s Nasdaq Listing Could Reset the AI Memory Trade
Key Points
- Interested in Micron Technology, Inc.? Here are five stocks we like better.
- SK Hynix's Nasdaq listing could raise up to $28 billion and trades at a discount to Micron, offering

The AI Chip Sell-Off Looks Scary, But the Real Story May Be Liquidity
Key Points
- Interested in NVIDIA Corporation? Here are five stocks we like better.
- South Korea’s sharp KOSPI sell-off pressured global chip stocks, but the move appears tied more to leverage and

Palantir's CEO Just Called Out OpenAI and Anthropic
Key Points
- Interested in Palantir Technologies Inc.? Here are five stocks we like better.
- CEO Alex Karp told CNBC that enterprises risk losing their competitive data advantage by relying on

Abivax: Wall Street Catches Up to the Data
Key Points
- Interested in Abivax SA Sponsored ADR? Here are five stocks we like better.
- Abivax shares rose more than 40% in a month after positive Phase 3 trial results for Obefazimod, a proposed

Enerpac (EPAC) Surpasses Q3 Earnings and Revenue Estimates
Enerpac (EPAC) came out with quarterly earnings of $0.6 per share, beating the Zacks Consensus Estimate of $0.49 per share. This compares to earnings of $0.51 per share a year ago. These figures are

Pepsi Stock: Buy Before Q2 Earnings or Is Coca-Cola the Better Investment?
PepsiCo PEP) is scheduled to report second-quarter 2026 results before the market opens on Thursday, July 9, kicking off the earnings season for many consumer staples companies.
Wall Street expects
Stock Screening Made Simple: A Closer Look
Stock screening is commonly deployed by investors to ‘cut through the noise.’ The approach is especially useful when considering the thousands of options to choose from, which can often overwhelm
Here's Why Valero Energy (VLO) Fell More Than Broader Market
Valero Energy (VLO) ended the recent trading session at $266.22, demonstrating a -1.52% change from the preceding day's closing price. This change lagged the S&P 500's 0.45% loss on the day

Vital Farms (VITL) Advances While Market Declines: Some Information for Investors
In the latest close session, Vital Farms (VITL) was up +2.41% at $13.15. The stock exceeded the S&P 500, which registered a loss of 0.45% for the day. On the other hand, the Dow registered a loss of

Online Pokies NZ Market Signals Reflected in Financial Platform
News
Best Forex Robot Performance: How Institutional-Level Automated Trading Is Now Available to Retail MT4 Accounts


Ross Stores (ROST) Rises As Market Takes a Dip: Key Facts
Ross Stores (ROST) closed the most recent trading day at $214.67, moving +1.57% from the previous trading session. The stock's performance was ahead of the S&P 500's daily loss of 0.45%. Meanwhile
Why the Market Dipped But United Parcel Service (UPS) Gained Today
United Parcel Service (UPS) closed the most recent trading day at $111.96, moving +1.76% from the previous trading session. The stock's performance was ahead of the S&P 500's daily loss of 0.45%
Twilio (TWLO) Increases Despite Market Slip: Here's What You Need to Know
In the latest close session, Twilio (TWLO) was up +1.38% at $211.97. The stock outperformed the S&P 500, which registered a daily loss of 0.45%. Meanwhile, the Dow lost 0.25%, and the Nasdaq, a

Symbotic Inc. (SYM) Dips More Than Broader Market: What You Should Know
Symbotic Inc. (SYM) ended the recent trading session at $41.32, demonstrating a -7.06% change from the preceding day's closing price. The stock fell short of the S&P 500, which registered a loss of
Tilray Brands, Inc. (TLRY) Declines More Than Market: Some Information for Investors
In the latest trading session, Tilray Brands, Inc. (TLRY) closed at $4.31, marking a -1.6% move from the previous day. This change lagged the S&P 500's daily loss of 0.45%. On the other hand, the

Why Cipher Digital Inc. (CIFR) Dipped More Than Broader Market Today
Cipher Digital Inc. (CIFR) closed at $20.47 in the latest trading session, marking a -5.8% move from the prior day. The stock's change was less than the S&P 500's daily loss of 0.45%. Meanwhile, the
Why the Market Dipped But Arch Capital Group (ACGL) Gained Today
Arch Capital Group (ACGL) closed at $102.85 in the latest trading session, marking a +1.02% move from the prior day. The stock outpaced the S&P 500's daily loss of 0.45%. At the same time, the Dow
Why Quanta Services (PWR) Dipped More Than Broader Market Today
Quanta Services (PWR) closed at $656.79 in the latest trading session, marking a -2.56% move from the prior day. The stock fell short of the S&P 500, which registered a loss of 0.45% for the day
Contest

Still running

Leeway
Die Analyse-Plattform Leeway untersucht mit KI-unterstützten Algorithmen aussagekräftige Zusammenhänge am Aktienmarkt. Anhand von vielen Millionen Datenpunkten finden die Algorithmen die Kennzahlen und Bewegungen, die nachweisbare Auswirkungen haben und Vorteile schaffen.
Kostenlos ausprobieren
Heibel Ticker
sharewise sagt: Stephan Heibel ist ein langähriger Unterstützer und Autor der Wunschanalyse. Er betreibt meiner Meinung nach einen der besten Börsenbriefe. Es gibt eine kostenlose und eine Premium Variante.
Kostenlos ausprobierensharewise
Du findest das sharewise Projekt spannend und möchtest es unterstützen?
Mit einer
sharewise+-Mitgliedschaft
unterstützt du uns finanziell und bekommst zusätzliche Funktionalitäten freigeschalten.
sharewise
Du findest das sharewise Projekt spannend und möchtest es unterstützen?
Mit einer
sharewise+-Mitgliedschaft
unterstützt du uns finanziell und bekommst zusätzliche Funktionalitäten freigeschalten.