

How does sharewise work?
Discuss
Discuss and share predictions for your favorite stocks in the forum. Let your opinion be heard
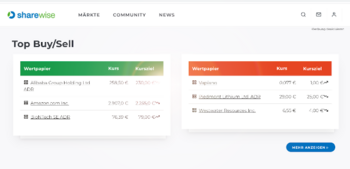
Show moreTop Buy/Sell (This Month)
| Security | Price | Target price |
|---|---|---|
| Micron Technology Inc. | €851.90 | €1,294.4 |
| Delta Air Lines Inc. | €75.39 | €72.62 |
| Aerovironment | €126.80 | €257.49 |
| Security | Price | Target price |
|---|---|---|
| Veganz Group AG | €2.83 | - |
| Jetblue Airways Corp. | €4.62 | €3.44 |
| Lennar Corp. A | €73.88 | €73.19 |
New Top predictions since last week
| Prediction | User | Perf. (%) |
|---|---|---|
| B Quantumcore Ltd. | AlexanderDanielSchneider | 19.32% |
| B Sivers Ima Holding Ab | AlexanderDanielSchneider | 17.95% |
| B Sivers Ima Holding Ab | Vassago1 | 16.35% |
| Prediction | User | Perf. (%) |
|---|---|---|
| S Veganz Group AG | blaugold | -30.65% |
| S Agenus Inc. | Wolf_of_WS | -20.00% |
| S HCA Holdings Inc. | Barclays PLC | -9.86% |
Many tell you which stocks to buy.
We measure how often they are right!


Portfolios of our members
A.D.S 4

When it comes to stocks, what is important for you?
Find stocks based on your criteria with our sharewise stock finder. All results are based on thousands of votes by our community
Pros and Cons of these stocks (New Predictions)
Uranium Energy Corp
WKN: A0JDRR / Name: Uranium Energy / Stock / Uranium / Small Cap /
Pros
Cons
Try sharewise+ and get hundreds more matching stocks
Sign up for free!Tops & Flops S&P 500
| Security | Price | Change(%) (%) |
|---|---|---|
| Paypal Holdings Inc | €49.42 | 19.130% |
| Discovery Communications C | €22.42 | 5.110% |
| Lam Research Corp. | €7,371.0 | 3.990% |
| Westrock Co | €47.53 | 3.930% |
| Carnival plc | €22.74 | 3.460% |
| Security | Price | Change(%) (%) |
|---|---|---|
| Pentair plc | €52.72 | -20.460% |
| Anthem Inc. | €340.80 | -9.530% |
| Progressive Corp. | €186.00 | -6.180% |
| ConAgra Foods Inc. | €11.79 | -4.690% |
| Centene Corp. | €58.00 | -3.620% |
Courses
sharewise Introduction

Get started on the stock market in these easy steps
Things you will learn:
- What is a stock
- What is a fund
- What is an ETF
- How to open a depot
- How to manage a depot that will regularly beat managed funds
- Why you mostly need patience to succeed on the stock market
Predictions
ServiceNow Inc.
14:16
15.07.27
14:25

Micron Technology Inc.
14:12
15.07.27
14:25
Quantum Corp.
14:11
12:20

Top News

Tower Semiconductor’s AI Rally Is Built on a Light-Speed Bet
Key Points
- Interested in Tower Semiconductor Ltd.? Here are five stocks we like better.
- Tower Semiconductor shares rose more than 13% after announcing a $3 billion dual-track expansion in Japan

Marriott vs. Viking: Why the Better Quarter Doesn't Mean the Better Decade
Key Points
- Interested in Marriott International, Inc.? Here are five stocks we like better.
- U.S. tourism spending hit roughly $1.35 trillion in 2025, with baby boomers outspending other

Barratt Redrow Q4 Earnings Call Highlights
Key Points
- Interested in Barratt Redrow plc? Here are five stocks we like better.
- Barratt Redrow reported a solid FY 2026, with completions up 5% to 17,667 homes and adjusted profit before tax

Celcuity Enters Commercial Stage as FDA Approves REVTORPYK for Advanced Breast Cancer
Key Points
- Interested in Celcuity, Inc.? Here are five stocks we like better.
- Celcuity won full FDA approval for gedatolisib, now branded REVTORPYK, in a specific advanced breast cancer

ASML Q2 Earnings Call Highlights
Key Points
- Interested in ASML Holding N.V.? Here are five stocks we like better.
- ASML beat second-quarter guidance with net sales of EUR 9.3 billion and a 54% gross margin, helped by

New Strong Buy Stocks for July 15th
Here are five stocks added to the Zacks Rank #1 (Strong Buy) List today:
BlackBerry Limited BB: This software and services company has seen the Zacks Consensus Estimate for its next year earnings


New Strong Sell Stocks for July 15th
Here are three stocks added to the Zacks Rank #5 (Strong Sell) List today:
BrightView Holdings, Inc. BV is a commercial landscaping services company. The Zacks Consensus Estimate for its current

Is FlexShares Credit-Scored US Corporate Bond ETF (SKOR) a Strong ETF Right Now?
Designed to provide broad exposure to the Investment Grade Corporate Bond ETFs category of the market, the FlexShares Credit-Scored US Corporate Bond ETF (SKOR) is a smart beta exchange traded fund
Is First Trust Small Cap Core AlphaDEX ETF (FYX) a Strong ETF Right Now?
Designed to provide broad exposure to the Style Box - Small Cap Blend category of the market, the First Trust Small Cap Core AlphaDEX ETF (FYX) is a smart beta exchange traded fund launched on
Should You Invest in the First Trust Cloud Computing ETF (SKYY)?
Looking for broad exposure to the Technology - Cloud Computing segment of the equity market? You should consider the First Trust Cloud Computing ETF (SKYY), a passively managed exchange traded fund

Should You Invest in the iShares U.S. Pharmaceuticals ETF (IHE)?
Looking for broad exposure to the Healthcare - Pharma segment of the equity market? You should consider the iShares U.S. Pharmaceuticals ETF (IHE), a passively managed exchange traded fund launched
News
Is WisdomTree U.S. High Dividend ETF (DHS) a Strong ETF Right Now?
The WisdomTree U.S. High Dividend ETF (DHS) was launched on 06/16/2006, and is a smart beta exchange traded fund designed to offer broad exposure to the Style Box - Large Cap Value category of the
Is Invesco RAFI US 1000 ETF (PRF) a Strong ETF Right Now?
The Invesco RAFI US 1000 ETF (PRF) was launched on 12/19/2005, and is a smart beta exchange traded fund designed to offer broad exposure to the Style Box - Large Cap Value category of the market.
Should You Invest in the Invesco Aerospace & Defense ETF (PPA)?
Designed to provide broad exposure to the Industrials - Aerospace & Defense segment of the equity market, the Invesco Aerospace & Defense ETF (PPA) is a passively managed exchange traded fund
Should You Invest in the State Street SPDR S&P Health Care Services ETF (XHS)?
Designed to provide broad exposure to the Healthcare - Services segment of the equity market, the State Street SPDR S&P Health Care Services ETF (XHS) is a passively managed exchange traded fund
Is iShares MSCI USA Quality GARP ETF (GARP) a Strong ETF Right Now?
Making its debut on 01/14/2020, smart beta exchange traded fund iShares MSCI USA Quality GARP ETF (GARP) provides investors broad exposure to the Style Box - All Cap Growth category of the market.
Best Growth Stocks to Buy for July 15th
Here are three stocks with buy ranks and strong growth characteristics for investors to consider today, July 15:
Ford Motor Company F: This automobile giant carries a Zacks Rank #1, and has
Best Value Stocks to Buy for July 15th
Here are three stocks with buy rank and strong value characteristics for investors to consider today, July 15:
Venture Global, Inc. VG: This liquefied natural gas company carries a Zacks Rank #1
The Zacks Analyst Blog Highlights Chevron, TotalEnergies, Robinhood, Oil-Dri and Aeries
For Immediate Release
Chicago, IL – July 15, 2026 – Zacks.com announces the list of stocks and ETFs featured in the Analyst Blog. Every day the Zacks Equity Research analysts discuss the latest news

The Zacks Analyst Blog Highlights Warner, News, Cinemark and CuriosityStream
For Immediate Release
Chicago, IL – July 15, 2026 – Zacks.com announces the list of stocks and ETFs featured in the Analyst Blog. Every day the Zacks Equity Research analysts discuss the latest news
Contest

Still running

Leeway
Die Analyse-Plattform Leeway untersucht mit KI-unterstützten Algorithmen aussagekräftige Zusammenhänge am Aktienmarkt. Anhand von vielen Millionen Datenpunkten finden die Algorithmen die Kennzahlen und Bewegungen, die nachweisbare Auswirkungen haben und Vorteile schaffen.
Kostenlos ausprobierensharewise
Du findest das sharewise Projekt spannend und möchtest es unterstützen?
Mit einer
sharewise+-Mitgliedschaft
unterstützt du uns finanziell und bekommst zusätzliche Funktionalitäten freigeschalten.

Heibel Ticker
sharewise sagt: Stephan Heibel ist ein langähriger Unterstützer und Autor der Wunschanalyse. Er betreibt meiner Meinung nach einen der besten Börsenbriefe. Es gibt eine kostenlose und eine Premium Variante.
Kostenlos ausprobierensharewise
Du findest das sharewise Projekt spannend und möchtest es unterstützen?
Mit einer
sharewise+-Mitgliedschaft
unterstützt du uns finanziell und bekommst zusätzliche Funktionalitäten freigeschalten.