

How does sharewise work?
Discuss
Discuss and share predictions for your favorite stocks in the forum. Let your opinion be heard
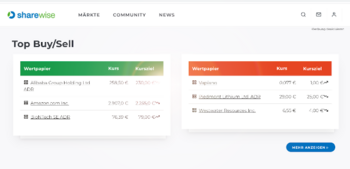
Show moreTop Buy/Sell (This Month)
| Security | Price | Target price |
|---|---|---|
| Micron Technology Inc. | €851.60 | €1,297.5 |
| Delta Air Lines Inc. | €75.18 | €72.62 |
| Aerovironment | €127.10 | €257.49 |
| Security | Price | Target price |
|---|---|---|
| Veganz Group AG | €2.78 | - |
| Jetblue Airways Corp. | €4.62 | €3.44 |
| Lennar Corp. A | €73.64 | €73.19 |
New Top predictions since last week
| Prediction | User | Perf. (%) |
|---|---|---|
| B Quantumcore Ltd. | AlexanderDanielSchneider | 19.32% |
| B Sivers Ima Holding Ab | AlexanderDanielSchneider | 17.95% |
| B Sivers Ima Holding Ab | Vassago1 | 16.35% |
| Prediction | User | Perf. (%) |
|---|---|---|
| S Veganz Group AG | blaugold | -32.66% |
| S Agenus Inc. | Wolf_of_WS | -19.27% |
| S Veganz Group AG | thomasw | -11.56% |
Many tell you which stocks to buy.
We measure how often they are right!


Portfolios of our members
A.D.S 4

When it comes to stocks, what is important for you?
Find stocks based on your criteria with our sharewise stock finder. All results are based on thousands of votes by our community
Pros and Cons of these stocks (New Predictions)
Uranium Energy Corp
WKN: A0JDRR / Name: Uranium Energy / Stock / Uranium / Small Cap /
Pros
Cons
Try sharewise+ and get hundreds more matching stocks
Sign up for free!Tops & Flops S&P 500
| Security | Price | Change(%) (%) |
|---|---|---|
| Paypal Holdings Inc | €48.50 | 16.900% |
| Discovery Communications C | €22.42 | 5.110% |
| Lam Research Corp. | €7,371.0 | 3.990% |
| Intel Corp. | €98.12 | 3.980% |
| Westrock Co | €47.53 | 3.930% |
| Security | Price | Change(%) (%) |
|---|---|---|
| Pentair plc | €54.86 | -17.230% |
| Kansas City Southern | €256.50 | -2.950% |
| Fidelity National Information Services Inc. | €35.56 | -2.770% |
| Gartner Inc. | €113.70 | -2.360% |
| Newell Rubbermaid | €4.39 | -2.190% |
Courses
sharewise Introduction


Key figures for stocks
Predictions

Uber Technologies Inc
14.07.26
14.07.27
11:29
Descartes Sys Grp Inc.
14.07.26
14.07.27
09:30
Top News

Celcuity Enters Commercial Stage as FDA Approves REVTORPYK for Advanced Breast Cancer
Key Points
- Interested in Celcuity, Inc.? Here are five stocks we like better.
- Celcuity won full FDA approval for gedatolisib, now branded REVTORPYK, in a specific advanced breast cancer

ASML Q2 Earnings Call Highlights
Key Points
- Interested in ASML Holding N.V.? Here are five stocks we like better.
- ASML beat second-quarter guidance with net sales of EUR 9.3 billion and a 54% gross margin, helped by

Phoenix Education Partners Q3 Earnings Call Highlights
Key Points
- Interested in Phoenix Education Partners, Inc.? Here are five stocks we like better.
- Q3 revenue was essentially flat at $271.8 million, but profit fell as Phoenix Education Partners

Aehr Test Systems Q4 Earnings Call Highlights
Key Points
- Interested in Aehr Test Systems? Here are five stocks we like better.
- Aehr Test Systems entered fiscal 2027 with a record backlog and raised revenue guidance to $130 million to $150

Kestra Medical Technologies Q4 Earnings Call Highlights
Key Points
- Interested in Kestra Medical Technologies, Ltd.? Here are five stocks we like better.
- Revenue surged in Q4, with Kestra posting $28.6 million in revenue, up 66% year over year
JPM Q2 Earnings Call Flags Strong Markets, Higher NII View
JPMorgan Chase & Co. JPM used its second-quarter 2026 earnings call to push the story beyond a headline beat and toward a stronger full-year revenue outlook. Management highlighted a rare mix of

Compared to Estimates, Citigroup (C) Q2 Earnings: A Look at Key Metrics (Revised)
For the quarter ended June 2026, Citigroup (C) reported revenue of $24.77 billion, up 14.3% over the same period last year. EPS came in at $3.15, compared to $1.96 in the year-ago quarter.
The
C Q2 Earnings Call Focuses on Pulling Growth Forward
Citigroup Inc. C used its second-quarter call to make a broader point than the headline beat. Management framed the quarter as evidence that the bank’s multiyear rebuild is producing stronger
3 Portfolio-Worthy Stocks to Consider as Q2 Earnings Approach: GE, TSM, UNH
As the second-quarter earnings season heats up, investors are looking for companies that combine durable long-term growth drivers with strong underlying fundamentals.
While quarterly reports can
Pan American Silver (PAAS) Outpaces Stock Market Gains: What You Should Know
Pan American Silver (PAAS) closed at $43.51 in the latest trading session, marking a +1.9% move from the prior day. The stock outperformed the S&P 500, which registered a daily gain of 0.38%
M/I Homes (MHO) Exceeds Market Returns: Some Facts to Consider
M/I Homes (MHO) closed at $148.11 in the latest trading session, marking a +1.4% move from the prior day. The stock outpaced the S&P 500's daily gain of 0.38%. Elsewhere, the Dow gained 0.02%, while
News
Main Street Capital (MAIN) Surpasses Market Returns: Some Facts Worth Knowing
Main Street Capital (MAIN) closed the most recent trading day at $53.09, moving +1.1% from the previous trading session. This change outpaced the S&P 500's 0.38% gain on the day. On the other hand

NXP Semiconductors (NXPI) Outpaces Stock Market Gains: What You Should Know
In the latest close session, NXP Semiconductors (NXPI) was up +1.97% at $283.87. The stock outpaced the S&P 500's daily gain of 0.38%. Elsewhere, the Dow gained 0.02%, while the tech-heavy Nasdaq
Rithm (RITM) Outperforms Broader Market: What You Need to Know
Rithm (RITM) closed at $9.22 in the latest trading session, marking a +1.65% move from the prior day. This move outpaced the S&P 500's daily gain of 0.38%. Elsewhere, the Dow gained 0.02%, while the

CSLM Acquisition Corp. (SPWR) Stock Sinks As Market Gains: What You Should Know
In the latest trading session, CSLM Acquisition Corp. (SPWR) closed at $0.63, marking a -2.76% move from the previous day. This move lagged the S&P 500's daily gain of 0.38%. Elsewhere, the Dow
Why Annaly Capital Management (NLY) Outpaced the Stock Market Today
In the latest close session, Annaly Capital Management (NLY) was up +2.13% at $23.01. This move outpaced the S&P 500's daily gain of 0.38%. On the other hand, the Dow registered a gain of 0.02%, and
Zoetis (ZTS) Stock Dips While Market Gains: Key Facts
Zoetis (ZTS) closed the most recent trading day at $74.07, moving -1.75% from the previous trading session. The stock's performance was behind the S&P 500's daily gain of 0.38%. Meanwhile, the Dow

Sunrun (RUN) Beats Stock Market Upswing: What Investors Need to Know
Sunrun (RUN) closed the most recent trading day at $12.78, moving +2.98% from the previous trading session. The stock's change was more than the S&P 500's daily gain of 0.38%. Meanwhile, the Dow

Dollar General (DG) Stock Drops Despite Market Gains: Important Facts to Note
In the latest close session, Dollar General (DG) was down 2.67% at $120.14. This change lagged the S&P 500's daily gain of 0.38%. Elsewhere, the Dow saw an upswing of 0.02%, while the tech-heavy
Booz Allen Hamilton (BAH) Stock Declines While Market Improves: Some Information for Investors
Booz Allen Hamilton (BAH) closed at $63.56 in the latest trading session, marking a -1.91% move from the prior day. The stock's performance was behind the S&P 500's daily gain of 0.38%. Meanwhile
Contest

Still running

Heibel Ticker
sharewise sagt: Stephan Heibel ist ein langähriger Unterstützer und Autor der Wunschanalyse. Er betreibt meiner Meinung nach einen der besten Börsenbriefe. Es gibt eine kostenlose und eine Premium Variante.
Kostenlos ausprobierensharewise
Du findest das sharewise Projekt spannend und möchtest es unterstützen?
Mit einer
sharewise+-Mitgliedschaft
unterstützt du uns finanziell und bekommst zusätzliche Funktionalitäten freigeschalten.

Leeway
Die Analyse-Plattform Leeway untersucht mit KI-unterstützten Algorithmen aussagekräftige Zusammenhänge am Aktienmarkt. Anhand von vielen Millionen Datenpunkten finden die Algorithmen die Kennzahlen und Bewegungen, die nachweisbare Auswirkungen haben und Vorteile schaffen.
Kostenlos ausprobierensharewise
Du findest das sharewise Projekt spannend und möchtest es unterstützen?
Mit einer
sharewise+-Mitgliedschaft
unterstützt du uns finanziell und bekommst zusätzliche Funktionalitäten freigeschalten.