

How does sharewise work?
Discuss
Discuss and share predictions for your favorite stocks in the forum. Let your opinion be heard
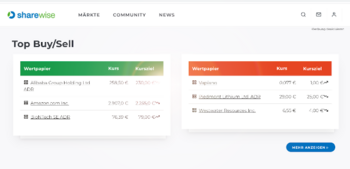
Show moreTop Buy/Sell (This Month)
| Security | Price | Target price |
|---|---|---|
| Micron Technology Inc. | €862.00 | €1,300.7 |
| Delta Air Lines Inc. | €80.13 | €84.23 |
| Oracle Corp. | €125.70 | €257.37 |
| Security | Price | Target price |
|---|---|---|
| Lennar Corp. A | €77.14 | €73.20 |
| Jetblue Airways Corp. | €5.10 | €3.43 |
| Southern Copper | €153.35 | €123.05 |
New Top predictions since last week
| Prediction | User | Perf. (%) |
|---|---|---|
| B Tenable Holdings Inc | JPMorgan Chase & Co. | 19.93% |
| B Ams-osram AG | gerihouse | 15.79% |
| B Microstrateg.a New | TD Cowen | 15.55% |
| Prediction | User | Perf. (%) |
|---|---|---|
| S Fuelcell Energy Inc. | Vassago1 | -23.11% |
| S Fuelcell Energy Inc. | michaelkr | -20.77% |
| S Intel Corp. | fenjal | -7.82% |
Many tell you which stocks to buy.
We measure how often they are right!


Portfolios of our members
Star depot

When it comes to stocks, what is important for you?
Find stocks based on your criteria with our sharewise stock finder. All results are based on thousands of votes by our community
Pros and Cons of these stocks (New Predictions)
Clearwater Paper
WKN: A0RDWM / Name: Clearwater / Stock / Paper & Forest Products / Small Cap /
Pros
Cons

Sphere Entertainment Co.
WKN: A2P2R5 / Name: Sphere Entertainment Co. / Stock / ? /
Pros
Cons
Try sharewise+ and get hundreds more matching stocks
Sign up for free!Tops & Flops S&P 500
| Security | Price | Change(%) (%) |
|---|---|---|
| Dentsply Sirona Inc. | €10.77 | 5.850% |
| PACCAR Inc. | €110.04 | 5.500% |
| Discovery Communications C | €22.42 | 5.110% |
| Resmed Inc. | €190.95 | 4.970% |
| NetApp Inc. | €142.28 | 4.300% |
| Security | Price | Change(%) (%) |
|---|---|---|
| Applied Materials Inc. | €518.40 | -6.440% |
| O'Reilly Automotive Inc. | €73.63 | -6.180% |
| KLA-Tencor Corp. | €204.00 | -6.070% |
| Tractor Supply Company | €26.41 | -5.570% |
| Coty Inc | €1.89 | -5.500% |
Courses
Get started on the stock market in these easy steps
Things you will learn:
- What is a stock
- What is a fund
- What is an ETF
- How to open a depot
- How to manage a depot that will regularly beat managed funds
- Why you mostly need patience to succeed on the stock market

sharewise Introduction
Predictions
Regeneron Pharmaceuticals Inc.
21:15
06.07.27
20:51
Top News

As Employers Drop Obesity Drug Coverage, Hims & Hers Could Be the Winner
Key Points
- Interested in Hims & Hers Health, Inc.? Here are five stocks we like better.
- Employers are expected to drop coverage for GLP-1 weight-loss drugs in 2027, potentially driving patients

KBR Insiders Are Buying While the Market Misreads Its Spinoff
Key Points
- Interested in KBR, Inc.? Here are five stocks we like better.
- KBR insiders bought shares in May as the company continued preparing to spin off Mission Technology Solutions.
- KBR’s

Contrarian Alert: 5 Downgraded Stocks That May Reward Long-Term Investors
Key Points
- Interested in Domino's Pizza Inc? Here are five stocks we like better.
- Domino’s Pizza, Lowe’s, Zscaler, ServiceNow and Tractor Supply have faced analyst price target cuts, but most
Doug Casey Calls AI a Super Bubble, Bets on Energy, Gold Miners and Grains
Key Points
- Interested in Ecopetrol S.A.? Here are five stocks we like better.
- Doug Casey argues today's AI infrastructure buildout mirrors history's biggest speculative manias, and warns that

This Edge AI Stock Just Got a Huge Vote of Confidence From Wall Street
Key Points
- Interested in Ambarella, Inc.? Here are five stocks we like better.
- Rosenblatt raised its Ambarella price target to a Wall Street high of $120 in late June, naming the stock a top pick

Online Pokies NZ Market Signals Reflected in Financial Platform

CSGP Strengthens Global Real Estate Platform With France Expansion
CoStar Group CSGP shares have plunged 55.4% year to date (YTD), significantly underperforming the Zacks Computer & Technology sector's return of 14.7%. The drop reflects investor concerns


NIKE's Wholesale Strength: A Signal of a Turnaround Ahead?
NIKE, Inc. NKE has been making efforts to drive growth at its wholesale segment. The company is rebuilding its wholesale partnerships by expanding its reach across retail channels and enhancing its
UnitedHealth Bets on Profitability Over Growth: Will It Pay Off?
UnitedHealth Group Incorporated UNH is navigating a more challenging operating environment as elevated healthcare utilization, rising Medicare Advantage costs and tighter reimbursement have
Novartis to Expand Oncology Pipeline With Myricx Bio Acquisition
Swiss pharma giant Novartis NVS announced an agreement to acquire privately held UK-based biotechnology company Myricx Bio, which is developing a novel class of antibody-drug conjugates (ADCs)

Will the Label Expansion of Trodelvy Strengthen GILD's Oncology Portfolio?
Gilead Sciences, Inc. GILD recently won FDA approval for the label expansion of breast cancer drug Trodelvy (sacituzumab govitecan-hziy) for the first-line treatment of adult patients with
News

Best Forex Robot Performance: How Institutional-Level Automated Trading Is Now Available to Retail MT4 Accounts

Navigating the Prospects for Bank ETFs as Q2 Earnings Season Kicks Off
A striking tug-of-war is playing out across Wall Street. On one side, investors are on high alert due to sudden economic mixed signals — namely a sharp cooldown in the labor market and sticky
ICON Stock Outlook 2026 as Margin Woes Meet a Stronger Backlog Base
ICON plc ICLR enters the second half of 2026 with an uneven investment profile. Customer demand signals improved in the latest quarter, but the operating model has not yet shown a clean recovery.

Missed SanDisk's 858% Surge in H1'26? These ETFs Still Offer Exposure
Memory giant SanDisk SNDK has emerged as the undisputed standout performer in the S&P 500 during the first half of 2026, with its shares skyrocketing an incredible 858%. This meteoric rise, fueled

Here's Why You Should Retain DexCom Stock in Your Portfolio for Now
DexCom, Inc. DXCM is well positioned for growth in the coming quarters, supported by the significant potential of the continuous glucose monitoring (CGM) market. A strong first-quarter 2026
Can IONQ's Security and Space Launches Accelerate Quantum Advantage Push?
IonQ IONQ is strengthening its commercial portfolio beyond quantum computing by expanding into quantum cybersecurity and space-based geospatial intelligence. In line with this, the company
Alignment Healthcare Outlook as MA Growth Fuels Margin Gains in 2026
Alignment Healthcare, Inc. ALHC is drawing investor attention as Medicare Advantage growth, quality ratings and operating leverage begin to show up in profitability. The company reported
KTOS Stock Jumps 23.6% in a Year: Is the Momentum Sustainable?
Kratos Defense & Security Solutions, Inc.’s KTOS shares have risen 23.6% over the past year compared with the Zacks Aerospace-Defense Equipment industry’s growth of 22.6%. The company continues to
BASF Wraps Up EUR 7.7B Coatings Sale to Carlyle, Holds 40% Interest
BASF SE BASFY recently announced the successful completion of the sale of its coatings business to global investment firm Carlyle, marking a major milestone in the company's portfolio transformation
Contest

Still running

Heibel Ticker
sharewise sagt: Stephan Heibel ist ein langähriger Unterstützer und Autor der Wunschanalyse. Er betreibt meiner Meinung nach einen der besten Börsenbriefe. Es gibt eine kostenlose und eine Premium Variante.
Kostenlos ausprobierensharewise
Du findest das sharewise Projekt spannend und möchtest es unterstützen?
Mit einer
sharewise+-Mitgliedschaft
unterstützt du uns finanziell und bekommst zusätzliche Funktionalitäten freigeschalten.

Leeway
Die Analyse-Plattform Leeway untersucht mit KI-unterstützten Algorithmen aussagekräftige Zusammenhänge am Aktienmarkt. Anhand von vielen Millionen Datenpunkten finden die Algorithmen die Kennzahlen und Bewegungen, die nachweisbare Auswirkungen haben und Vorteile schaffen.
Kostenlos ausprobierensharewise
Du findest das sharewise Projekt spannend und möchtest es unterstützen?
Mit einer
sharewise+-Mitgliedschaft
unterstützt du uns finanziell und bekommst zusätzliche Funktionalitäten freigeschalten.