

How does sharewise work?
Discuss
Discuss and share predictions for your favorite stocks in the forum. Let your opinion be heard
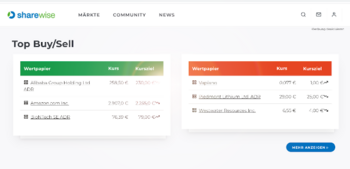
Show moreTop Buy/Sell (This Month)
| Security | Price | Target price |
|---|---|---|
| NVIDIA Corp. | €181.88 | €216.93 |
| Palo Alto Networks | €230.95 | €257.58 |
| Zscaler Inc | €112.00 | €262.70 |
| Security | Price | Target price |
|---|---|---|
| HP Inc. | €21.88 | €16.33 |
| General Mills Inc. | €28.70 | €39.58 |
| Delivery Hero SE | €38.51 | - |
New Top predictions since last week
| Prediction | User | Perf. (%) |
|---|---|---|
| B Abivax S.a. | thomasw | 26.52% |
| B Abivax S.A. | thomasw | 24.57% |
| B Nel ASA ADR | DerAlmanach100000 | 15.11% |
| Prediction | User | Perf. (%) |
|---|---|---|
| S Battalion Oil Corp. | Bankster | -37.29% |
| S Solidion Technology Inc. | daimler1 | -36.52% |
| S Digital Brands Group Inc. | Wolf_of_WS | -33.17% |
Many tell you which stocks to buy.
We measure how often they are right!


Portfolios of our members
A.D.S 2

When it comes to stocks, what is important for you?
Find stocks based on your criteria with our sharewise stock finder. All results are based on thousands of votes by our community
Pros and Cons of these stocks (New Predictions)
Try sharewise+ and get hundreds more matching stocks
Sign up for free!Try sharewise+ and get hundreds more matching stocks
Sign up for free!Tops & Flops S&P 500
| Security | Price | Change(%) (%) |
|---|---|---|
| Discovery Communications C | €22.42 | 5.110% |
| Micron Technology Inc. | €860.90 | 4.940% |
| Kohl's Corp. | €14.08 | 4.780% |
| Ipg Photonics | €96.48 | 4.510% |
| Bath & Body Works Inc. | €15.87 | 4.490% |
| Security | Price | Change(%) (%) |
|---|---|---|
| Eversource Energy | €59.50 | -4.070% |
| Martin Marietta Materials | €480.40 | -3.640% |
| Celanese Corp. A | €42.58 | -3.340% |
| Helmerich & Payne Inc | €32.50 | -3.310% |
| NOV Inc. | ? | -3.280% |
Courses
sharewise Introduction


sharewise advanced features
Also you get more information about our Pro and Cons feature, where we bring the wisdom of crowds to a new level.
For discussing with your friends and managing your investment clubs we will show you how to create your own stock debates.#
Predictions
Hewlett Packard Enterprise Co
01:25
09.06.27
08:21

Establishment Labs Holdings Inc
08.06.26
08.06.27
08:17

Top News

Zepp Health Q1 Earnings Call Highlights
Key Points
- Interested in Zepp Health Corporation Sponsored ADR? Here are five stocks we like better.
- Zepp Health posted a strong Q1, with total revenue rising 33.8% year over year to $51.5

Hemab Therapeutics Details Post-IPO Pipeline Push, Sutacimig Phase III Plans
Key Points
- Interested in Hemab Therapeutics Holdings, Inc.? Here are five stocks we like better.
- Hemab Therapeutics said its lead drug sutacimig is on track to enter a pivotal Phase III trial

CareDx Sharpens Precision Diagnostics Push With Naveris Deal, AlloHeme Plans
Key Points
- Interested in CareDx, Inc.? Here are five stocks we like better.
- CareDx is pivoting deeper into precision diagnostics by divesting its lab products unit and using the proceeds to
Bioventus Highlights PNS, PRP Growth as Cash Flow Improves and Debt Falls
Key Points
- Interested in Bioventus Inc.? Here are five stocks we like better.
- Bioventus said its financial profile has improved materially, with EBITDA margins rising above 20% in 2025, free
Vail Resorts Q3 Earnings Call Highlights
Key Points
- Interested in Vail Resorts, Inc.? Here are five stocks we like better.
- Severe weather across the Western U.S., especially in the Rockies, hurt Vail Resorts’ fiscal third-quarter


2 Simple Traits of Outperforming Stocks
Investors are always on the hunt for stocks that deliver market-beating gains. Of course, finding big-time winners is much easier said than done, but investors can still deploy a basic framework


Annaly Capital Management (NLY) Stock Sinks As Market Gains: Here's Why
Annaly Capital Management (NLY) closed at $20.96 in the latest trading session, marking a -1.23% move from the prior day. This change lagged the S&P 500's 0.3% gain on the day. Elsewhere, the Dow
Western Union (WU) Stock Drops Despite Market Gains: Important Facts to Note
Western Union (WU) closed the most recent trading day at $7.36, moving -1.6% from the previous trading session. The stock fell short of the S&P 500, which registered a gain of 0.3% for the day. At

Tilray Brands, Inc. (TLRY) Exceeds Market Returns: Some Facts to Consider
Tilray Brands, Inc. (TLRY) closed the most recent trading day at $5.03, moving +1.82% from the previous trading session. The stock outperformed the S&P 500, which registered a daily gain of 0.3%
Compared to Estimates, Vail Resorts (MTN) Q3 Earnings: A Look at Key Metrics
For the quarter ended April 2026, Vail Resorts (MTN) reported revenue of $1.21 billion, down 7% over the same period last year. EPS came in at $8.81, compared to $10.54 in the year-ago quarter.
The
News
Casino Bonuses Through a Financial Lens: Value, Risk, and Consumer Strategy


Mama's Creations Q1 Earnings Call Highlights
Key Points
- Interested in Mama's Creations, Inc.? Here are five stocks we like better.
- Mama's Creations posted a strong Q1 fiscal 2027, with revenue up 49.7% to $52.8 million, net income up
Gloo Q1 Earnings Call Highlights
Key Points
- Interested in Gloo Holdings? Here are five stocks we like better.
- Gloo beat Q1 expectations with revenue of $41.5 million, up 238% year over year, and adjusted EBITDA loss of $11.5
Mission Produce Q2 Earnings Call Highlights
Key Points
- Interested in Mission Produce, Inc.? Here are five stocks we like better.
- Mission Produce’s fiscal Q2 was hit by a severe avocado oversupply, especially from Mexico, which pushed
Kinder Morgan (KMI) Stock Falls Amid Market Uptick: What Investors Need to Know
In the latest close session, Kinder Morgan (KMI) was down 1.23% at $31.29. This change lagged the S&P 500's 0.3% gain on the day. At the same time, the Dow lost 0.16%, and the tech-heavy Nasdaq
RTX (RTX) Stock Declines While Market Improves: Some Information for Investors
In the latest trading session, RTX (RTX) closed at $178.66, marking a -1.29% move from the previous day. The stock fell short of the S&P 500, which registered a gain of 0.3% for the day. Elsewhere
SkyWest (SKYW) Stock Declines While Market Improves: Some Information for Investors
In the latest trading session, SkyWest (SKYW) closed at $83.54, marking a -1.07% move from the previous day. The stock's change was less than the S&P 500's daily gain of 0.3%. Elsewhere, the Dow saw
Deckers (DECK) Exceeds Market Returns: Some Facts to Consider
Deckers (DECK) closed the most recent trading day at $109.73, moving +1.48% from the previous trading session. The stock's change was more than the S&P 500's daily gain of 0.3%. On the other hand
Pilgrim's Pride (PPC) Stock Drops Despite Market Gains: Important Facts to Note
Pilgrim's Pride (PPC) closed at $29.18 in the latest trading session, marking a -2.34% move from the prior day. This move lagged the S&P 500's daily gain of 0.3%. Meanwhile, the Dow lost 0.16%, and
Contest

Still running
sharewise
Du findest das sharewise Projekt spannend und möchtest es unterstützen?
Mit einer
sharewise+-Mitgliedschaft
unterstützt du uns finanziell und bekommst zusätzliche Funktionalitäten freigeschalten.

Leeway
Die Analyse-Plattform Leeway untersucht mit KI-unterstützten Algorithmen aussagekräftige Zusammenhänge am Aktienmarkt. Anhand von vielen Millionen Datenpunkten finden die Algorithmen die Kennzahlen und Bewegungen, die nachweisbare Auswirkungen haben und Vorteile schaffen.
Kostenlos ausprobieren
Heibel Ticker
sharewise sagt: Stephan Heibel ist ein langähriger Unterstützer und Autor der Wunschanalyse. Er betreibt meiner Meinung nach einen der besten Börsenbriefe. Es gibt eine kostenlose und eine Premium Variante.
Kostenlos ausprobierensharewise
Du findest das sharewise Projekt spannend und möchtest es unterstützen?
Mit einer
sharewise+-Mitgliedschaft
unterstützt du uns finanziell und bekommst zusätzliche Funktionalitäten freigeschalten.