

How does sharewise work?
Discuss
Discuss and share predictions for your favorite stocks in the forum. Let your opinion be heard
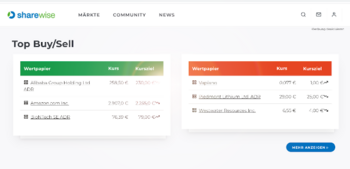
Show moreTop Buy/Sell (This Month)
| Security | Price | Target price |
|---|---|---|
| Palo Alto Networks | €287.05 | €287.31 |
| Micron Technology Inc. | €940.80 | €1,301.2 |
| Okta Inc. | €113.12 | €105.85 |
| Security | Price | Target price |
|---|---|---|
| Lennar Corp. A | €82.12 | €73.20 |
| General Mills Inc. | €31.60 | €36.13 |
| Dollar Tree Inc. | €107.48 | €108.76 |
New Top predictions since last week
| Prediction | User | Perf. (%) |
|---|---|---|
| B Groupon Inc. | Traumtanz | 33.38% |
| B Bio-Techne Corp. | TD Cowen | 25.97% |
| B Astrotech Corp. | daimler1 | 19.10% |
| Prediction | User | Perf. (%) |
|---|---|---|
| S Ohb SE | daimler1 | -15.19% |
| S Qualcomm Inc. | Barclays PLC | -11.48% |
| S Seagate Technology.Holdings plc | DerAlmanach100000 | -9.71% |
Many tell you which stocks to buy.
We measure how often they are right!


Portfolios of our members
Turnaround-Aktien

When it comes to stocks, what is important for you?
Find stocks based on your criteria with our sharewise stock finder. All results are based on thousands of votes by our community
Pros and Cons of these stocks (New Predictions)
Global Fashion Group SA
WKN: A2PLUG / Name: Global Fashion Group / Stock / Small Cap /
Pros
Cons
Singulus Technologies AG
WKN: A1681X / Name: Singulus / Stock / Machinery, Equipment & Components / Small Cap /
Pros
Cons
Try sharewise+ and get hundreds more matching stocks
Sign up for free!Tops & Flops S&P 500
| Security | Price | Change(%) (%) |
|---|---|---|
| Charter Communications Inc. A | €130.78 | 11.400% |
| Applied Materials Inc. | €603.90 | 10.040% |
| Corning Inc. | €211.55 | 8.020% |
| KLA-Tencor Corp. | €233.15 | 7.340% |
| Comcast Corp. | €21.70 | 6.770% |
| Security | Price | Change(%) (%) |
|---|---|---|
| Verizon Communications Inc. | €37.75 | -7.600% |
| Gap Inc. | €16.62 | -6.340% |
| Macy's Inc. | €21.39 | -6.140% |
| T-Mobile US Inc. | €150.48 | -6.100% |
| AT&T Inc.. | €18.75 | -5.930% |
Courses

sharewise advanced features
Also you get more information about our Pro and Cons feature, where we bring the wisdom of crowds to a new level.
For discussing with your friends and managing your investment clubs we will show you how to create your own stock debates.#

sharewise Introduction
Predictions

Top News

Qualcomm’s Investor Day Just Changed the Growth Story Forever
Key Points
- Interested in Qualcomm Incorporated? Here are five stocks we like better.
- Qualcomm nearly doubled its fiscal 2029 non-handset revenue target to $40 billion, spanning data center

JPMorgan Stands by Sky-High Broadcom Target as Shares Slide
Key Points
- Interested in Broadcom Inc.? Here are five stocks we like better.
- Broadcom’s sell-off has centered on concerns that Alphabet could diversify more of its TPU work beyond Broadcom.

Is Apple’s Latest Plunge the Canary in the Coal Mine for Tech Stocks?
Key Points
- Interested in Apple Inc.? Here are five stocks we like better.
- Apple shares suffered their worst trading day in more than a year on Thursday, dropping over 6% after the company

5 Places Investors Can Hide If the AI Trade Keeps Cracking
Key Points
- Interested in iShares Biotechnology ETF? Here are five stocks we like better.
- Investors are beginning to rotate away from the most crowded AI-related trades.
- Five areas stand out as
New Stock Price Highs Are on the Menu for Darden Restaurants
Key Points
- Interested in Darden Restaurants, Inc.? Here are five stocks we like better.
- Darden Restaurants posted strong fiscal Q4 results, with revenue rising 13.7% to $3.72 billion and adjusted

Finanzmärkte im Wandel und wie neue digitale Dynamiken Investoren beeinflussen


Payment Rails Are Becoming the New iGaming Growth Story

SpaceX Set for Rapid Entry into Nasdaq-100: ETFs in Focus
SpaceX SPCX is poised to become one of the fastest additions ever to the Nasdaq-100 index, triggering a new wave of demand from passive investors less than a month after its blockbuster public


The Zacks Analyst Blog Highlights The Kroger, Worthington Enterprises, Delta Air Line, Northeast Community Bancorp and World Kinect
For Immediate Release
Chicago, IL – June 29, 2026 – Zacks.com announces the list of stocks featured in the Analyst Blog. Every day the Zacks Equity Research analysts discuss the latest news and
Wall Street Analysts Think Signet (SIG) Could Surge 26.34%: Read This Before Placing a Bet
Shares of Signet (SIG) have gained 0.2% over the past four weeks to close the last trading session at $87.54, but there could still be a solid upside left in the stock if short-term price targets of
News

Wall Street Analysts Predict a 36.23% Upside in Phibro (PAHC): Here's What You Should Know
Shares of Phibro Animal Health (PAHC) have gained 2.9% over the past four weeks to close the last trading session at $31.69, but there could still be a solid upside left in the stock if short-term

Market Sentiment Shaped by Digital Casino Environments

Bears are Losing Control Over China Construction Bank (CICHY), Here's Why It's a 'Buy' Now
The price trend for China Construction Bank Corp. (CICHY) has been bearish lately and the stock has lost 7.5% over the past two weeks. However, the formation of a hammer chart pattern in its last
Wall Street Analysts Think Hewlett Packard Enterprise (HPE) Could Surge 54.93%: Read This Before Placing a Bet
Hewlett Packard Enterprise (HPE) closed the last trading session at $43.71, gaining 1.6% over the past four weeks, but there could be plenty of upside left in the stock if short-term price targets

NTRS Post-Stress Test Policy: Does it Highlight Capital Strength?
Following the Federal Reserve’s 2026 stress test results, Northern Trust Corporation NTRS announced its intention to increase its quarterly common dividend 10% from 80 cents to 88 cents per share
RDNT's Unit DeepHealth Expands AI Breast Suite With FDA-Cleared Tools
DeepHealth, a wholly owned subsidiary of RadNet RDNT, recently received FDA clearances for two new functionalities within its AI-powered Breast Suite. The FDA clearances expand its AI-powered Breast
AstraZeneca's Enhertu Wins EU Nod for HER2-Positive Solid Tumors
AstraZeneca AZN and its Japan-based partner Daiichi Sankyo announced that the European Commission (EC) has approved their blockbuster antibody-drug conjugate (ADC), Enhertu, as a monotherapy for
NFLX Continues to Expand Its Advertising Platform: What's Ahead?
Netflix NFLX continues to strengthen its advertising platform, positioning the business as an increasingly important growth driver beyond subscription revenues. The company is expanding its in-house
Contest

Still running
sharewise
Du findest das sharewise Projekt spannend und möchtest es unterstützen?
Mit einer
sharewise+-Mitgliedschaft
unterstützt du uns finanziell und bekommst zusätzliche Funktionalitäten freigeschalten.

Leeway
Die Analyse-Plattform Leeway untersucht mit KI-unterstützten Algorithmen aussagekräftige Zusammenhänge am Aktienmarkt. Anhand von vielen Millionen Datenpunkten finden die Algorithmen die Kennzahlen und Bewegungen, die nachweisbare Auswirkungen haben und Vorteile schaffen.
Kostenlos ausprobieren
Heibel Ticker
sharewise sagt: Stephan Heibel ist ein langähriger Unterstützer und Autor der Wunschanalyse. Er betreibt meiner Meinung nach einen der besten Börsenbriefe. Es gibt eine kostenlose und eine Premium Variante.
Kostenlos ausprobierensharewise
Du findest das sharewise Projekt spannend und möchtest es unterstützen?
Mit einer
sharewise+-Mitgliedschaft
unterstützt du uns finanziell und bekommst zusätzliche Funktionalitäten freigeschalten.