

How does sharewise work?
Discuss
Discuss and share predictions for your favorite stocks in the forum. Let your opinion be heard
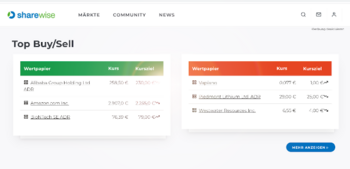
Show moreTop Buy/Sell (This Month)
| Security | Price | Target price |
|---|---|---|
| Micron Technology Inc. | €816.30 | €1,297.5 |
| Delta Air Lines Inc. | €80.22 | €78.24 |
| Oracle Corp. | €126.84 | €257.37 |
| Security | Price | Target price |
|---|---|---|
| Lennar Corp. A | €77.28 | €73.20 |
| Jetblue Airways Corp. | €5.29 | €3.43 |
| Southern Copper | €149.70 | €123.05 |
New Top predictions since last week
| Prediction | User | Perf. (%) |
|---|---|---|
| B Crinetics Pharmaceuticals Inc | UBS Group AG | 98.58% |
| B Tenable Holdings Inc | JPMorgan Chase & Co. | 20.60% |
| B Microstrateg.a New | TD Cowen | 15.85% |
| Prediction | User | Perf. (%) |
|---|---|---|
| S Fuelcell Energy Inc. | Vassago1 | -23.11% |
| S Fuelcell Energy Inc. | michaelkr | -20.77% |
| S Sandisk Corp. | mixitrader | -10.49% |
Many tell you which stocks to buy.
We measure how often they are right!


Portfolios of our members
A.D.S.....9

When it comes to stocks, what is important for you?
Find stocks based on your criteria with our sharewise stock finder. All results are based on thousands of votes by our community
Pros and Cons of these stocks (New Predictions)
Geci International S.a.
WKN: A3E2CS / Name: Geci International S.a. / Stock / ? /
Pros
Cons
BICO Group AB
WKN: A2PX00 / Name: BICO Group / Stock / Small Cap /
Pros
Cons
Try sharewise+ and get hundreds more matching stocks
Sign up for free!Tops & Flops S&P 500
| Security | Price | Change(%) (%) |
|---|---|---|
| Fiserv Inc. | €47.70 | 5.410% |
| Discovery Communications C | €22.42 | 5.110% |
| Lam Research Corp. | €7,371.0 | 3.990% |
| Westrock Co | €47.53 | 3.930% |
| ServiceNow Inc. | €98.00 | 3.900% |
| Security | Price | Change(%) (%) |
|---|---|---|
| Western Digital Corp. | €470.15 | -6.860% |
| Applied Materials Inc. | €483.70 | -6.690% |
| Seagate Technology.Holdings plc | €710.00 | -6.580% |
| Teradyne Inc. | €310.80 | -6.320% |
| KLA-Tencor Corp. | €191.38 | -6.190% |
Courses

Key figures for stocks

sharewise Introduction
Predictions
Vertex Pharmaceuticals Inc.
15:00
07.07.27
13:52
Crinetics Pharmaceuticals Inc
15:00
07.07.27
14:20
Top News

2 Short Squeezes for Summer Speculation: What the Bears Are Getting Wrong
Key Points
- Interested in The Wendy's Company? Here are five stocks we like better.
- Wendy's, with 33% short interest, could see a short squeeze as new CEO Bob Wright pursues digital initiatives

How TeraWulf’s Anthropic Deal Booted Up a $19B AI Empire
Key Points
- Interested in TeraWulf Inc.? Here are five stocks we like better.
- TeraWulf signed a 20-year lease with Anthropic that is expected to generate about $19 billion in contracted revenue.

Small-Cap ETFs Poised for Big Growth as Rate Outlook Shifts
Key Points
- Interested in Avantis U.S. Small Cap Value ETF? Here are five stocks we like better.
- Avantis U.S. Small Cap Value gives investors active exposure to profitable, lower-valuation

Flash Crash or Cash? The AI Hardware Reset Investors Can’t Ignore
Key Points
- Interested in Micron Technology, Inc.? Here are five stocks we like better.
- A $137 billion memory-stock sell-off sparked retail fears of an AI hardware supply glut, but institutional

As Employers Drop Obesity Drug Coverage, Hims & Hers Could Be the Winner
Key Points
- Interested in Hims & Hers Health, Inc.? Here are five stocks we like better.
- Employers are expected to drop coverage for GLP-1 weight-loss drugs in 2027, potentially driving patients

Make the Most of Your Retirement with These Top-Ranked Mutual Funds
There is never a wrong time to invest in mutual funds for retirement. So, if you're still looking for the best mutual funds, the Zacks Mutual Fund Rank can be a great guide.
The best way to


3 Magnificent Mutual Funds to Maximize Your Retirement Portfolio
Investing in mutual funds for retirement is never too late. And the Zacks Mutual Fund Rank can be an excellent tool for investors looking to invest in the best funds.
The easiest, most reliable way

Are these 3 Top-Ranked Mutual Funds In Your Retirement Portfolio?
There is never a wrong time to invest in mutual funds for retirement. So, if you're still looking for the best mutual funds, the Zacks Mutual Fund Rank can be a great guide.
The easiest, most

Dow Jones Tops 53,000 for the First Time: ETFs to Gain
The Dow Jones Industrial Average index hit a record high of 53,000 for the first time on July 6, 2026, per CNBC. The Dow Jones index advanced 8.9% during the first six months of this year, marking
These 3 Mutual Funds Could Be the Biggest Winners of 2H 2026
As investors navigate the second half of 2026, mutual funds with strong fundamentals and favorable analyst ratings are attracting renewed attention. While markets continue to face uncertainty from

Online Pokies NZ Market Signals Reflected in Financial Platform
News
Best Forex Robot Performance: How Institutional-Level Automated Trading Is Now Available to Retail MT4 Accounts

Is ECMMX a Strong Bond Fund Right Now?
If you're looking for a Muni - Bonds fund category, then a potential option is Eaton Vance MA Municipals C (ECMMX). ECMMX bears a Zacks Mutual Fund Rank of 3 (Hold), which is based on various
Is Edgewood Growth Fund Retail (EGFFX) a Strong Mutual Fund Pick Right Now?
If investors are looking at the Large Cap Growth fund category, make sure to pass over Edgewood Growth Fund Retail (EGFFX). EGFFX carries a Zacks Mutual Fund Rank of 5 (Strong Sell), which is based
Is PPSAX a Strong Bond Fund Right Now?
Having trouble finding a Investment Grade Bond - Intermediate fund? Principal Spectrum Preferred and Capital Securities Income A (PPSAX) is a potential starting point. PPSAX carries a Zacks Mutual
Is NMTRX a Strong Bond Fund Right Now?
If you've been stuck searching for Muni - Bonds funds, you might want to consider passing on by Nuveen Municipals Total Return Managed Accounts Portfolio (NMTRX) as a possibility. NMTRX possesses a
Is Fidelity Select Defense & Aerospace (FSDAX) a Strong Mutual Fund Pick Right Now?
Any investors hoping to find a Sector - Other fund could think about starting with Fidelity Select Defense & Aerospace (FSDAX). FSDAX holds a Zacks Mutual Fund Rank of 2 (Buy), which is based on

Bull of the Day: Amtech Systems (ASYS)
Sometimes the best AI investments aren't the companies designing the chips. Lately, it’s been the ones building the equipment that makes those chips possible. That's where Amtech Systems (ASYS)
Bear of the Day: Caesars Entertainment (CZR)
Sometimes a stock looks cheap for a reason. Most of the time, the reason is macro trends affecting the industry the stock is in. No matter how nice it looks on paper, no matter how much value you
3 Top-Ranked Municipal Bond Funds to Generate Reliable Income
The debt securities category will always be the first choice for risk-averse investors because this class of instruments provides a regular income at low levels of risk. Income from regular
Contest

Still running

Leeway
Die Analyse-Plattform Leeway untersucht mit KI-unterstützten Algorithmen aussagekräftige Zusammenhänge am Aktienmarkt. Anhand von vielen Millionen Datenpunkten finden die Algorithmen die Kennzahlen und Bewegungen, die nachweisbare Auswirkungen haben und Vorteile schaffen.
Kostenlos ausprobierensharewise
Du findest das sharewise Projekt spannend und möchtest es unterstützen?
Mit einer
sharewise+-Mitgliedschaft
unterstützt du uns finanziell und bekommst zusätzliche Funktionalitäten freigeschalten.

Heibel Ticker
sharewise sagt: Stephan Heibel ist ein langähriger Unterstützer und Autor der Wunschanalyse. Er betreibt meiner Meinung nach einen der besten Börsenbriefe. Es gibt eine kostenlose und eine Premium Variante.
Kostenlos ausprobierensharewise
Du findest das sharewise Projekt spannend und möchtest es unterstützen?
Mit einer
sharewise+-Mitgliedschaft
unterstützt du uns finanziell und bekommst zusätzliche Funktionalitäten freigeschalten.