

How does sharewise work?
Discuss
Discuss and share predictions for your favorite stocks in the forum. Let your opinion be heard
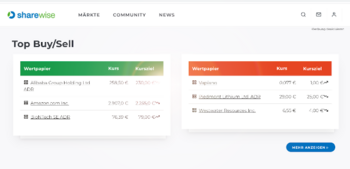
Show moreTop Buy/Sell (This Month)
| Security | Price | Target price |
|---|---|---|
| Micron Technology Inc. | €811.10 | €1,294.4 |
| Delta Air Lines Inc. | €75.29 | €72.62 |
| Aerovironment | €125.25 | €257.49 |
| Security | Price | Target price |
|---|---|---|
| Veganz Group AG | €2.74 | - |
| Jetblue Airways Corp. | €4.62 | €3.44 |
| Lennar Corp. A | €73.22 | €73.19 |
New Top predictions since last week
| Prediction | User | Perf. (%) |
|---|---|---|
| B Quantumcore Ltd. | AlexanderDanielSchneider | 19.32% |
| B Sivers Ima Holding Ab | AlexanderDanielSchneider | 17.95% |
| B Sivers Ima Holding Ab | Vassago1 | 16.35% |
| Prediction | User | Perf. (%) |
|---|---|---|
| S Veganz Group AG | blaugold | -31.91% |
| S Agenus Inc. | Wolf_of_WS | -15.64% |
| S Q32 Bio Inc. | thomasw | -14.77% |
Many tell you which stocks to buy.
We measure how often they are right!


Portfolios of our members
A.D.S 4

When it comes to stocks, what is important for you?
Find stocks based on your criteria with our sharewise stock finder. All results are based on thousands of votes by our community
Pros and Cons of these stocks (New Predictions)
Uranium Energy Corp
WKN: A0JDRR / Name: Uranium Energy / Stock / Uranium / Small Cap /
Pros
Cons
Try sharewise+ and get hundreds more matching stocks
Sign up for free!Tops & Flops S&P 500
| Security | Price | Change(%) (%) |
|---|---|---|
| Paypal Holdings Inc | €48.39 | 16.630% |
| Coty Inc | €2.14 | 8.630% |
| Discovery Communications C | €22.42 | 5.110% |
| Invesco Ltd. | €26.36 | 4.730% |
| Dentsply Sirona Inc. | €11.65 | 4.720% |
| Security | Price | Change(%) (%) |
|---|---|---|
| Pentair plc | €55.40 | -16.420% |
| Anthem Inc. | €336.00 | -10.800% |
| Progressive Corp. | €182.10 | -8.150% |
| Corning Inc. | €151.26 | -7.960% |
| Western Digital Corp. | €457.05 | -7.370% |
Courses
sharewise Introduction


sharewise advanced features
Also you get more information about our Pro and Cons feature, where we bring the wisdom of crowds to a new level.
For discussing with your friends and managing your investment clubs we will show you how to create your own stock debates.#
Predictions
Intercontinental Exchange Inc.
16:30
15.07.27
15:59
Top News

3 Gold Stocks Under $5 With Massive Upside
Key Points
- Interested in Gold Royalty Corp.? Here are five stocks we like better.
- Central banks purchased 474 tons of gold in Q1 2026, and nearly 90% plan to keep increasing reserves over the

Blueprint for a Billion: Nebius Group Secures the AI Floor
Key Points
- Interested in Nebius Group N.V.? Here are five stocks we like better.
- Nebius Group's stock dropped roughly 6% on 15 million shares traded as macroeconomic concerns triggered a broad

Fractyl Health Says Revita Helped Patients Keep Weight Off After Stopping GLP-1s
Key Points
- Interested in Fractyl Health, Inc.? Here are five stocks we like better.
- Fractyl Health said its Revita procedure helped patients keep more of their GLP-1-driven weight loss after

Conagra Brands Q4 Earnings Call Highlights
Key Points
- Interested in Conagra Brands? Here are five stocks we like better.
- Conagra Brands said fiscal Q4 and full-year results were within its original guidance, but sales were flat and

BlackRock Q2 Earnings Call Highlights
Key Points
- Interested in BlackRock? Here are five stocks we like better.
- BlackRock posted record Q2 results, with revenue up 31% to $7.1 billion, adjusted operating income up 39% to $2.9

AbbVie Inc. (ABBV) Is a Trending Stock: Facts to Know Before Betting on It
AbbVie (ABBV) has been one of the most searched-for stocks on Zacks.com lately. So, you might want to look at some of the facts that could shape the stock's performance in the near term.
Over the


Oracle Corporation (ORCL) Is a Trending Stock: Facts to Know Before Betting on It
Oracle (ORCL) has recently been on Zacks.com's list of the most searched stocks. Therefore, you might want to consider some of the key factors that could influence the stock's performance in the

Abercrombie & Fitch Company (ANF) is Attracting Investor Attention: Here is What You Should Know
Abercrombie & Fitch (ANF) has been one of the most searched-for stocks on Zacks.com lately. So, you might want to look at some of the facts that could shape the stock's performance in the near term.

Meta Platforms, Inc. (META) is Attracting Investor Attention: Here is What You Should Know
Meta Platforms (META) has recently been on Zacks.com's list of the most searched stocks. Therefore, you might want to consider some of the key factors that could influence the stock's performance in
First Solar, Inc. (FSLR) is Attracting Investor Attention: Here is What You Should Know
First Solar (FSLR) is one of the stocks most watched by Zacks.com visitors lately. So, it might be a good idea to review some of the factors that might affect the near-term performance of the stock.
Baidu, Inc. (BIDU) is Attracting Investor Attention: Here is What You Should Know
Baidu Inc. (BIDU) has recently been on Zacks.com's list of the most searched stocks. Therefore, you might want to consider some of the key factors that could influence the stock's performance in the
News
Broadcom Inc. (AVGO) Is a Trending Stock: Facts to Know Before Betting on It
Broadcom Inc. (AVGO) has been one of the most searched-for stocks on Zacks.com lately. So, you might want to look at some of the facts that could shape the stock's performance in the near term.
Over
Investors Heavily Search Royal Caribbean Cruises Ltd. (RCL): Here is What You Need to Know
Royal Caribbean (RCL) has been one of the most searched-for stocks on Zacks.com lately. So, you might want to look at some of the facts that could shape the stock's performance in the near term.
Bristol Myers Squibb Company (BMY) is Attracting Investor Attention: Here is What You Should Know
Bristol Myers Squibb (BMY) has been one of the most searched-for stocks on Zacks.com lately. So, you might want to look at some of the facts that could shape the stock's performance in the near
Here is What to Know Beyond Why Warner Bros. Discovery, Inc. (WBD) is a Trending Stock
Warner Bros. Discovery (WBD) has been one of the most searched-for stocks on Zacks.com lately. So, you might want to look at some of the facts that could shape the stock's performance in the near
Is Most-Watched Stock CocaCola Company (The) (KO) Worth Betting on Now?
Coca-Cola (KO) has recently been on Zacks.com's list of the most searched stocks. Therefore, you might want to consider some of the key factors that could influence the stock's performance in the
Strategy Inc (MSTR) Is a Trending Stock: Facts to Know Before Betting on It
Strategy (MSTR) is one of the stocks most watched by Zacks.com visitors lately. So, it might be a good idea to review some of the factors that might affect the near-term performance of the stock.
Albemarle Corporation (ALB) is Attracting Investor Attention: Here is What You Should Know
Albemarle (ALB) has recently been on Zacks.com's list of the most searched stocks. Therefore, you might want to consider some of the key factors that could influence the stock's performance in the
Modine Manufacturing Company (MOD) Is a Trending Stock: Facts to Know Before Betting on It
Modine (MOD) has been one of the most searched-for stocks on Zacks.com lately. So, you might want to look at some of the facts that could shape the stock's performance in the near term.
Over the
Investors Heavily Search Gray Media Inc. (GTN): Here is What You Need to Know
Gray Media (GTN) has been one of the most searched-for stocks on Zacks.com lately. So, you might want to look at some of the facts that could shape the stock's performance in the near term.
Over the
Contest

Still running

Heibel Ticker
sharewise sagt: Stephan Heibel ist ein langähriger Unterstützer und Autor der Wunschanalyse. Er betreibt meiner Meinung nach einen der besten Börsenbriefe. Es gibt eine kostenlose und eine Premium Variante.
Kostenlos ausprobierensharewise
Du findest das sharewise Projekt spannend und möchtest es unterstützen?
Mit einer
sharewise+-Mitgliedschaft
unterstützt du uns finanziell und bekommst zusätzliche Funktionalitäten freigeschalten.

Leeway
Die Analyse-Plattform Leeway untersucht mit KI-unterstützten Algorithmen aussagekräftige Zusammenhänge am Aktienmarkt. Anhand von vielen Millionen Datenpunkten finden die Algorithmen die Kennzahlen und Bewegungen, die nachweisbare Auswirkungen haben und Vorteile schaffen.
Kostenlos ausprobierensharewise
Du findest das sharewise Projekt spannend und möchtest es unterstützen?
Mit einer
sharewise+-Mitgliedschaft
unterstützt du uns finanziell und bekommst zusätzliche Funktionalitäten freigeschalten.