

How does sharewise work?
Discuss
Discuss and share predictions for your favorite stocks in the forum. Let your opinion be heard
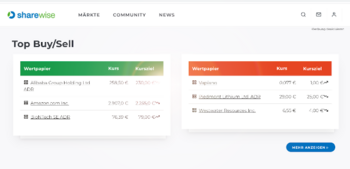
Show moreTop Buy/Sell (This Month)
| Security | Price | Target price |
|---|---|---|
| Micron Technology Inc. | €847.00 | €1,294.4 |
| Delta Air Lines Inc. | €75.21 | €72.92 |
| Aerovironment | €127.60 | €257.49 |
| Security | Price | Target price |
|---|---|---|
| Veganz Group AG | €2.64 | - |
| Jetblue Airways Corp. | €5.02 | €3.44 |
| Lennar Corp. A | €73.00 | €73.19 |
New Top predictions since last week
| Prediction | User | Perf. (%) |
|---|---|---|
| B Battalion Oil Corp. | daimler1 | 24.82% |
| B Battalion Oil Corp. | AlexanderDanielSchneider | 22.30% |
| B Quantumcore Ltd. | AlexanderDanielSchneider | 19.32% |
| Prediction | User | Perf. (%) |
|---|---|---|
| S Veganz Group AG | blaugold | -34.42% |
| S Moderna Inc. | Bank of America Co. | -16.00% |
| S Veganz Group AG | thomasw | -12.93% |
Many tell you which stocks to buy.
We measure how often they are right!


Portfolios of our members
A.D.S.....9

When it comes to stocks, what is important for you?
Find stocks based on your criteria with our sharewise stock finder. All results are based on thousands of votes by our community
Pros and Cons of these stocks (New Predictions)
Uranium Energy Corp
WKN: A0JDRR / Name: Uranium Energy / Stock / Uranium / Small Cap /
Pros
Cons
Try sharewise+ and get hundreds more matching stocks
Sign up for free!Tops & Flops S&P 500
| Security | Price | Change(%) (%) |
|---|---|---|
| H&R Block Inc. | €35.90 | 6.000% |
| Gartner Inc. | €124.15 | 5.230% |
| Discovery Communications C | €22.42 | 5.110% |
| Humana Inc. | €358.00 | 4.070% |
| Lam Research Corp. | €7,371.0 | 3.990% |
| Security | Price | Change(%) (%) |
|---|---|---|
| Expedia Inc. | €224.85 | -3.640% |
| Darden Restaurants Inc. | €172.85 | -3.130% |
| Kansas City Southern | €256.50 | -2.950% |
| Rockwell Automation | €404.60 | -2.340% |
| Leggett & Platt Inc. | €9.40 | -2.290% |
Courses

sharewise advanced features
Also you get more information about our Pro and Cons feature, where we bring the wisdom of crowds to a new level.
For discussing with your friends and managing your investment clubs we will show you how to create your own stock debates.#

sharewise Introduction
Predictions
Energy Fuels Inc.
03:33
14.07.27
11:24
Uranium Energy Corp
03:32
14.07.27
11:55

Top News

Ericsson Q2 Earnings Call Highlights
Key Points
- Interested in Ericsson? Here are five stocks we like better.
- Ericsson’s Q2 results were mixed: organic sales declined 1% year over year, but adjusted gross margin improved to 48.4%

Watches of Switzerland Group H2 Earnings Call Highlights
Key Points
- Interested in Watches of Switzerland Group plc? Here are five stocks we like better.
- Watches of Switzerland posted record fiscal 2026 results, with sales up 13% in constant currency
Lineage Cell Therapeutics Maps COR1 Path With ‘Thaw and Inject’ Cell Therapy Plan
Key Points
- Interested in Lineage Cell Therapeutics, Inc.? Here are five stocks we like better.
- Lineage Cell Therapeutics outlined a manufacturing-first strategy for COR1, its preclinical

Contango ORE Goes Hedge-Free, Eyes Full Gold Upside and Kitsault Silver Growth
Key Points
- Interested in Contango ORE, Inc.? Here are five stocks we like better.
- Contango ORE eliminated its hedge book, converting its remaining gold hedges into debt so shareholders now

Trex Overhauls Distribution Network, Raises 2026 Outlook After Q2 Beat
Key Points
- Interested in Trex Company, Inc.? Here are five stocks we like better.
- Trex is overhauling its distribution network by naming Specialty Building Products (SBP) its sole national
Stock Market News for July 14, 2026
Wall Street closed lower on Monday as rising oil prices and escalating U.S.-Iran tensions pressured market sentiment. The Nasdaq Composite, the Dow and the S&P 500 ended in negative territory.
How


Bull of the Day: Alphabet (GOOG)
In one form or another, most investors already own Alphabet (GOOG). As one of the world's largest publicly traded companies, it ranks as a dominant holding in nearly every major index and ETF. Yet

Bear of the Day: Winnebago Industries (WGO)
Winnebago Industries (WGO) is one of the most recognizable names in the RV and outdoor recreation market, with a long operating history and a portfolio of well-known brands.
But brand strength alone
The Zacks Analyst Blog Highlights SAP, UBS Group, Cadence, Village Super Market and Medalist Diversified
For Immediate Release
Chicago, IL – July 14, 2026 – Zacks.com announces the list of stocks and ETFs featured in the Analyst Blog. Every day the Zacks Equity Research analysts discuss the latest news
News


Resideo Technologies Targets Margin Growth as ADI Spin-Off Reshapes Strategy
Key Points
- Interested in Resideo Technologies, Inc.? Here are five stocks we like better.
- Resideo is positioning itself as a standalone building technologies company after the planned ADI
Contest

Still running

Heibel Ticker
sharewise sagt: Stephan Heibel ist ein langähriger Unterstützer und Autor der Wunschanalyse. Er betreibt meiner Meinung nach einen der besten Börsenbriefe. Es gibt eine kostenlose und eine Premium Variante.
Kostenlos ausprobierensharewise
Du findest das sharewise Projekt spannend und möchtest es unterstützen?
Mit einer
sharewise+-Mitgliedschaft
unterstützt du uns finanziell und bekommst zusätzliche Funktionalitäten freigeschalten.

Leeway
Die Analyse-Plattform Leeway untersucht mit KI-unterstützten Algorithmen aussagekräftige Zusammenhänge am Aktienmarkt. Anhand von vielen Millionen Datenpunkten finden die Algorithmen die Kennzahlen und Bewegungen, die nachweisbare Auswirkungen haben und Vorteile schaffen.
Kostenlos ausprobierensharewise
Du findest das sharewise Projekt spannend und möchtest es unterstützen?
Mit einer
sharewise+-Mitgliedschaft
unterstützt du uns finanziell und bekommst zusätzliche Funktionalitäten freigeschalten.