

How does sharewise work?
Discuss
Discuss and share predictions for your favorite stocks in the forum. Let your opinion be heard
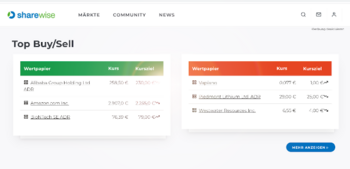
Show moreTop Buy/Sell (This Month)
| Security | Price | Target price |
|---|---|---|
| Micron Technology Inc. | €757.10 | €1,297.5 |
| Delta Air Lines Inc. | €74.05 | €72.49 |
| Aerovironment | €124.95 | €256.98 |
| Security | Price | Target price |
|---|---|---|
| Jetblue Airways Corp. | €4.88 | €3.44 |
| MGM Resorts International | €40.62 | €40.50 |
| Paychex Inc. | €100.92 | €95.54 |
New Top predictions since last week
| Prediction | User | Perf. (%) |
|---|---|---|
| B Veganz Group AG | AlexanderDanielSchneider | 29.61% |
| B Neuronetics | BTIG Research | 11.36% |
| B Axt Inc. | DerAlmanach100000 | 10.78% |
| Prediction | User | Perf. (%) |
|---|---|---|
| S Netflix Inc. | Barclays PLC | -8.27% |
| S Tesla Inc | Wells Fargo & Company | -7.09% |
| S Playtech Ltd | Morgan Stanley | -5.80% |
Many tell you which stocks to buy.
We measure how often they are right!


Portfolios of our members
A.D.S 2

When it comes to stocks, what is important for you?
Find stocks based on your criteria with our sharewise stock finder. All results are based on thousands of votes by our community
Pros and Cons of these stocks (New Predictions)
Enlivex Therapeutics Ltd.
WKN: A119KH / Name: Enlivex Therapeutics / Stock / Biotechnology & Medical Research / Small Cap /
Pros
Cons
Heckler & Koch Beteiligungs AG
WKN: A11Q13 / Name: Heckler & Koch / Stock / Aerospace & Defense / Micro Cap /
Pros
Cons
Try sharewise+ and get hundreds more matching stocks
Sign up for free!Tops & Flops S&P 500
| Security | Price | Change(%) (%) |
|---|---|---|
| Global Payments | €72.20 | 5.870% |
| Harley-Davidson Inc. | €24.38 | 5.430% |
| Discovery Communications C | €22.42 | 5.110% |
| Coty Inc | €2.38 | 4.350% |
| Brown-Forman Corp. B | €23.15 | 4.160% |
| Security | Price | Change(%) (%) |
|---|---|---|
| Ipg Photonics | €85.80 | -5.590% |
| Whirlpool Corp. | €32.34 | -4.730% |
| Chipotle Mexican Grill Inc. | €29.05 | -3.990% |
| Dentsply Sirona Inc. | €11.79 | -3.950% |
| United Parcel Service Inc. | €99.12 | -3.690% |
Courses
sharewise Introduction


sharewise advanced features
Also you get more information about our Pro and Cons feature, where we bring the wisdom of crowds to a new level.
For discussing with your friends and managing your investment clubs we will show you how to create your own stock debates.#
Predictions
PNC Financial Services Group
21:15
20.07.27
22:25
Top News

The Ugliest Stocks in the Market Just Got a Very Expensive Vote of Confidence
Key Points
- Interested in Oklo Inc.? Here are five stocks we like better.
- Institutional traders have been buying large blocks of call options in X-Energy, Oklo, and IonQ, all of which have fallen

Is Domino's Stock Serving Up a Buying Opportunity?
Key Points
- Interested in Domino's Pizza Inc? Here are five stocks we like better.
- Domino's Pizza reported a second-quarter revenue beat of $1.19 billion but missed earnings per share estimates

A $1T Black Hole: SpaceX Eyes Pentagon AI to Break Free
Key Points
- Interested in SpaceX? Here are five stocks we like better.
- SpaceX shares have fallen below their $135 IPO price, erasing over $1 trillion in implied market value amid concerns about

Magnolia Oil & Gas Bets Big on Eagle Ford With $4.06B WildFire Deal
Key Points
- Interested in Magnolia Oil & Gas Corp? Here are five stocks we like better.
- Magnolia Oil & Gas agreed to buy WildFire Energy for about $4.06 billion, a deal that would make it the

Domino's Pizza Q2 Earnings Call Highlights
Key Points
- Interested in Domino's Pizza Inc? Here are five stocks we like better.
- U.S. order counts stayed strong in Q2, but same-store sales came in softer than expected because average

NVIDIA & Micron: 2 Profitable AI Stocks With Strong Growth Potential
Investors mostly favor companies that generate strong returns after covering both operating and non-operating expenses. As a result, businesses that consistently report profits tend to be more


4 Discounted PEG Value Picks Following the June CPI Inflation Report
The softer-than-expected June Consumer Price Index (CPI) report strengthened expectations that the Federal Reserve could begin easing monetary policy later this year, helping support broader equity
The Next Big AI Winner: Cybersecurity
Thus far, the artificial intelligence boom rewarded the companies supplying the necessary computing power. Semiconductors, servers, networking equipment and data centers became the market’s primary

Netflix's Weak Outlook Overshadows Q2 Earnings Beat: Time to Hold?
Netflix NFLX delivered second-quarter 2026 results that beat the Zacks Consensus Estimate for earnings, yet the streaming giant's cautious commentary on engagement and margin pressure has left
AMD: Hyperscaler Deals Drive Growth
AMD Company Overview
Zacks Rank #3 (Hold) stock Advanced Micro Devices (AMD) is a leading fabless semiconductor company. The term “fabless” means that AMD designs the blueprints for its hardware and
4 Medical Products Stocks Poised to Win Despite Industry Headwinds
The Zacks Medical – Products industry is navigating an uneven operating environment where macroeconomic headwinds are colliding with strong structural healthcare demand. Rising tariffs, persistent
News
5 Founder-Led Companies Built to Innovate and Outperform
An updated edition of the May 29, 2026, article.Founders often exert a lasting influence on the companies they establish, shaping their strategic direction, culture and long-term goals. Driven by
Lenovo vs. Dell: Which AI PC Stock Is the Better Buy Now?
The microcomputer space is being driven by AI-enabled PCs, enterprise device refresh cycles, and the growing adoption of hybrid work. Rising demand for high-performance computing, cloud-connected
The Zacks Analyst Blog Highlights Apple, JPMorgan Chase, ExxonMobil, Smith-Midland and Coffee Holding
For Immediate Release
Chicago, IL – July 20, 2026 – Zacks.com announces the list of stocks featured in the Analyst Blog. Every day the Zacks Equity Research analysts discuss the latest news and
The Zacks Analyst Blog Highlights Micron Technology and Taiwan Semiconductor Manufacturing
For Immediate Release
Chicago, IL – July 20, 2026 – Zacks.com announces the list of stocks featured in the Analyst Blog. Every day the Zacks Equity Research analysts discuss the latest news and
Is WPC Stock Worth Retaining in Your Portfolio for the Long Run?
W.P. Carey WPC owns a large portfolio of mission-critical commercial properties across North America and Europe, backed by long-term triple-net leases that provide stable rental income. Most leases
Contest

Still running

Leeway
Die Analyse-Plattform Leeway untersucht mit KI-unterstützten Algorithmen aussagekräftige Zusammenhänge am Aktienmarkt. Anhand von vielen Millionen Datenpunkten finden die Algorithmen die Kennzahlen und Bewegungen, die nachweisbare Auswirkungen haben und Vorteile schaffen.
Kostenlos ausprobierensharewise
Du findest das sharewise Projekt spannend und möchtest es unterstützen?
Mit einer
sharewise+-Mitgliedschaft
unterstützt du uns finanziell und bekommst zusätzliche Funktionalitäten freigeschalten.

Heibel Ticker
sharewise sagt: Stephan Heibel ist ein langähriger Unterstützer und Autor der Wunschanalyse. Er betreibt meiner Meinung nach einen der besten Börsenbriefe. Es gibt eine kostenlose und eine Premium Variante.
Kostenlos ausprobierensharewise
Du findest das sharewise Projekt spannend und möchtest es unterstützen?
Mit einer
sharewise+-Mitgliedschaft
unterstützt du uns finanziell und bekommst zusätzliche Funktionalitäten freigeschalten.