

How does sharewise work?
Discuss
Discuss and share predictions for your favorite stocks in the forum. Let your opinion be heard
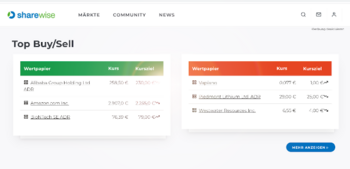
Show moreTop Buy/Sell (This Month)
| Security | Price | Target price |
|---|---|---|
| Micron Technology Inc. | €810.70 | €1,300.7 |
| ServiceNow Inc. | €86.90 | €136.09 |
| United Rentals Inc. | €1,004.5 | €1,018.4 |
| Security | Price | Target price |
|---|---|---|
| Northern Trust Corp. | €156.40 | €130.10 |
| Clorox Co. | €84.04 | €86.92 |
| Jetblue Airways Corp. | €4.38 | €3.44 |
New Top predictions since last week
| Prediction | User | Perf. (%) |
|---|---|---|
| B Tenet Healthcare | Guggenheim | 18.39% |
| B Murata Manufacturing Co Ltd | fenjal | 15.76% |
| B Imax Corp. | Rosenblatt Securities | 12.35% |
| Prediction | User | Perf. (%) |
|---|---|---|
| S Veganz Group AG | michaelkr | -18.46% |
| S Tesla Inc | Glj Research | -17.88% |
| S Intel Corp. | Rosenblatt Securities | -9.96% |
Many tell you which stocks to buy.
We measure how often they are right!


Portfolios of our members
A.D.S 2

When it comes to stocks, what is important for you?
Find stocks based on your criteria with our sharewise stock finder. All results are based on thousands of votes by our community
Pros and Cons of these stocks (New Predictions)
Bloom Energy Corp
WKN: A2JQTG / Symbol: BE / Name: Bloom Energy / Stock / Small Cap /
Pros
Cons
Douglas AG
WKN: BEAU1Y / Name: Douglas / Stock / ? /
Pros
Cons
Try sharewise+ and get hundreds more matching stocks
Sign up for free!Tops & Flops S&P 500
| Security | Price | Change(%) (%) |
|---|---|---|
| Digital Realty Trust | €174.95 | 12.180% |
| Allegion plc | €135.85 | 11.210% |
| Schlumberger Ltd. | €46.15 | 10.540% |
| International Paper | €37.20 | 10.180% |
| ServiceNow Inc. | €86.90 | 7.380% |
| Security | Price | Change(%) (%) |
|---|---|---|
| Intel Corp. | €81.22 | -7.730% |
| Seagate Technology.Holdings plc | €750.00 | -7.460% |
| C.H. Robinson Worldwide Inc. | €164.05 | -7.000% |
| Micron Technology Inc. | €810.70 | -6.960% |
| Teradyne Inc. | €307.85 | -6.760% |
Courses

Key figures for stocks

sharewise Introduction
Predictions
Honeywell International
21:30
24.07.27
26.06.26
Crown Castle Internatl Corp.
21:00
24.07.27
22:25
International Business Machines Corp
21:00
24.07.27
22:25
Top News

WSFS Financial Q2 Earnings Call Highlights
Key Points
- Interested in WSFS Financial Corporation? Here are five stocks we like better.
- WSFS Financial posted strong second-quarter 2026 results, with core EPS of $1.66, core ROA of 1.55%

Grupo Televisa Q2 Earnings Call Highlights
Grupo Televisa (NYSE:TV) said its telecom operations continued to improve in the second quarter of 2026, with lower churn, expanding profitability and ongoing fiber-network upgrades, while

CPB Q2 Earnings Call Highlights
Key Points
- Interested in CPB Inc.? Here are five stocks we like better.
- Central Pacific Financial (CPB) posted second-quarter net income of $20.8 million, or $0.80 per diluted share, up 19%

Universal Insurance Q2 Earnings Call Highlights
Key Points
- Interested in Universal Insurance Holdings Inc? Here are five stocks we like better.
- Universal Insurance posted stronger Q2 results, with adjusted diluted EPS rising to $1.84 from

Verizon Communications Q2 Earnings Call Highlights
Key Points
- Interested in Verizon Communications Inc.? Here are five stocks we like better.
- Verizon raised its 2026 outlook after a stronger second quarter, now expecting higher mobility and

Online Pokies NZ Market Signals Reflected in Financial Platform

Forget AI Chips and the Mag 7: Buy AI Infrastructure Stocks (VRT, EME) Now
Investors aiming to buy into the artificial intelligence boom driving the economy and Wall Street for the foreseeable future might want to consider best-in-class, AI-boosted infrastructure stocks.


Northeast Community Bancorp (NECB) Q2 Earnings and Revenues Lag Estimates
Northeast Community Bancorp (NECB) came out with quarterly earnings of $0.72 per share, missing the Zacks Consensus Estimate of $0.77 per share. This compares to earnings of $0.82 per share a year

3 High-Momentum Stocks to Buy Now Before They Surge
For investors seeking to maximize returns, high-momentum stocks merit close attention. To identify stocks with strong upside potential, investors can adopt Richard Driehaus’s “buy high and sell


HIG's Q2 Earnings Beat Estimates on Strong Investment Income
The Hartford Insurance Group, Inc. HIG delivered second-quarter fiscal 2026 earnings per share of $3.42, up 6% year over year and above the Zacks Consensus Estimate of $3.12 by 9.6%.
Revenues came
News

Can CBRE Group Stock Keep Its Winning Streak Alive in Q2?
CBRE Group, Inc. CBRE, the global leader in real estate services, is set to announce its second-quarter 2026 earnings on July 29, before the bell. The company has established itself as a leader in

PayPal to Report Q2 Earnings: What Should Investors Do?
PayPal PYPL is set to report its second-quarter 2026 results on July 28, before the opening bell.
This digital payment company expected currency-neutral revenue growth in the low single digits for

SL Green Q2 FFO Beat Estimates on Leasing Gains, '26 Guidance Raised
SL Green Realty Corp. SLG reported second-quarter 2026 funds from operations (FFO) per share of $1.43, which beat the Zacks Consensus Estimate of $1.19 by 20.17%. However, FFO declined 12.3% from

Skyworks to Report Q3 Earnings: What's in Store for the Stock?
Skyworks Solutions SWKS is slated to release third-quarter fiscal 2026 results on July 28.For the third quarter of fiscal 2026, the company expects non-GAAP earnings of $1.03 per share at the


Phillips Edison & Company, Inc. Q2 Earnings Call Highlights
Key Points
- Interested in Phillips Edison & Company, Inc.? Here are five stocks we like better.
- Phillips Edison reported a strong Q2, with higher FFO, Core FFO and same-center NOI, supported by

First Hawaiian Q2 Earnings Call Highlights
Key Points
- Interested in First Hawaiian, Inc.? Here are five stocks we like better.
- Loan growth and margin improved in Q2 2026, with total loans up $137 million and net interest margin rising

EQNR Q2 Earnings Miss Estimates, Revenues Rise Y/Y on Higher Output
Equinor ASA EQNR reported second-quarter 2026 adjusted earnings of $1.33 per share, missing the Zacks Consensus Estimate of $1.38 by 3.6%. The bottom line surged 107.8% from 64 cents in the year-ago

NextEra Energy Q2 Earnings Surpass Estimates, Revenues Miss
NextEra Energy NEE reported second-quarter 2026 results with adjusted earnings per share of $1.15, up 9.5% from $1.05 a year ago. The figure beat the Zacks Consensus Estimate of $1.09 by 5.5%
Contest

Still running
sharewise
Du findest das sharewise Projekt spannend und möchtest es unterstützen?
Mit einer
sharewise+-Mitgliedschaft
unterstützt du uns finanziell und bekommst zusätzliche Funktionalitäten freigeschalten.

Heibel Ticker
sharewise sagt: Stephan Heibel ist ein langähriger Unterstützer und Autor der Wunschanalyse. Er betreibt meiner Meinung nach einen der besten Börsenbriefe. Es gibt eine kostenlose und eine Premium Variante.
Kostenlos ausprobieren
Leeway
Die Analyse-Plattform Leeway untersucht mit KI-unterstützten Algorithmen aussagekräftige Zusammenhänge am Aktienmarkt. Anhand von vielen Millionen Datenpunkten finden die Algorithmen die Kennzahlen und Bewegungen, die nachweisbare Auswirkungen haben und Vorteile schaffen.
Kostenlos ausprobierensharewise
Du findest das sharewise Projekt spannend und möchtest es unterstützen?
Mit einer
sharewise+-Mitgliedschaft
unterstützt du uns finanziell und bekommst zusätzliche Funktionalitäten freigeschalten.